Intro
You have to dig a little to find out about this somewhat obscure topic. You want to send syslog output, e.g., from the named daemon, to a syslog server with beefed up security, such that it requires the use of TLS so traffic is encrypted. This is how I did that.
The details
This is what worked for me:
...
# DrJ fixes - log local0 to DrJ's dmz syslog server - DrJ 5/6/20
# use local0 for named's query log, but also log locally
# see https://www.linuxquestions.org/questions/linux-server-73/bind-queries-log-to-remote-syslog-server-4175
669371/
# @@ means use TCP
$DefaultNetstreamDriver gtls
$DefaultNetstreamDriverCAFile /etc/ssl/certs/GlobalSign_Root_CA_-_R3.pem
$ActionSendStreamDriver gtls
$ActionSendStreamDriverMode 1
$ActionSendStreamDriverAuthMode anon

local0.*                                @@(o)14.17.85.10:6514
#local0.*                               /var/lib/named/query.log
local1.*                                -/var/log/localmessages
#local0.*;local1.*                      -/var/log/localmessages
local2.*;local3.*                       -/var/log/localmessages
local4.*;local5.*                       -/var/log/localmessages
local6.*;local7.*                       -/var/log/localmessages
...
# DrJ fixes - log local0 to DrJ's dmz syslog server - DrJ 5/6/20
# use local0 for named's query log, but also log locally
# see https://www.linuxquestions.org/questions/linux-server-73/bind-queries-log-to-remote-syslog-server-4175
669371/
# @@ means use TCP
$DefaultNetstreamDriver gtls
$DefaultNetstreamDriverCAFile /etc/ssl/certs/GlobalSign_Root_CA_-_R3.pem
$ActionSendStreamDriver gtls
$ActionSendStreamDriverMode 1
$ActionSendStreamDriverAuthMode anon
local0.* @@(o)14.17.85.10:6514
#local0.* /var/lib/named/query.log
local1.* -/var/log/localmessages
#local0.*;local1.* -/var/log/localmessages
local2.*;local3.* -/var/log/localmessages
local4.*;local5.* -/var/log/localmessages
local6.*;local7.* -/var/log/localmessages
The above is the important part of my /etc/rsyslog.conf file. The SIEM server is running at IP address 14.17.85.10 on TCP port 6514. It is using a certificate issued by Globalsign. An openssl call confirms this (see references).
Other gothcas
I am running on a SLES 15 server. Although it had rsyslog installed, it did not support tls initially. I was getting a dlopen error. So I figured out I needed to install this module:
Intro
I share some Zabbix items I’ve had to create which I find useful.
Low-level discovery to discover IPSEC tunnels on an F5 BigIP
IPSec tunnels are weird insofar as there is one IKE SA but potentially lots of SAs – two for each traffic selector. So if your traffic selector is called proxy-01, some OIDs you’ll see in your SNMP walk will be like …proxy-01.58769, …proxy-01.58770. So to review, do an snmpwalk on the F5 itself. That command is something like
snmpwalk -v3 -l authPriv -u proxyUser -a SHA -A shaAUTHpwd -x AES -X AESpwd -c public 127.0.0.1 SNMPv2-SMI::enterprises >/tmp/snmpwalk-ent
Now…how to translate this LLD? In my case I have a template since there are several F5s which need this. The template already has discovery rules for Pool discovery, Virtual server discovery, etc. So first thing we do is add a Tunnel discovery rule.
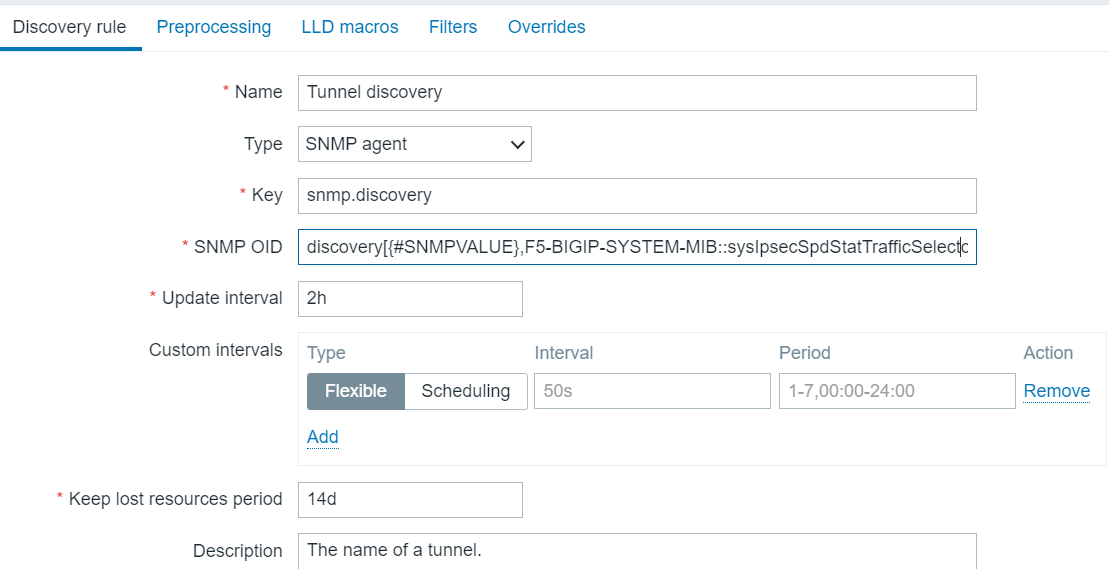
Tunnel Discovery Rule
The SNMP OID is clipped at the end. In full it is:
Initially I tried something else, but that did not go so well.
Now we want to know the tunnel status (up or down) and the amount of traffic over the tunnel. We create two item prototypes to get those.
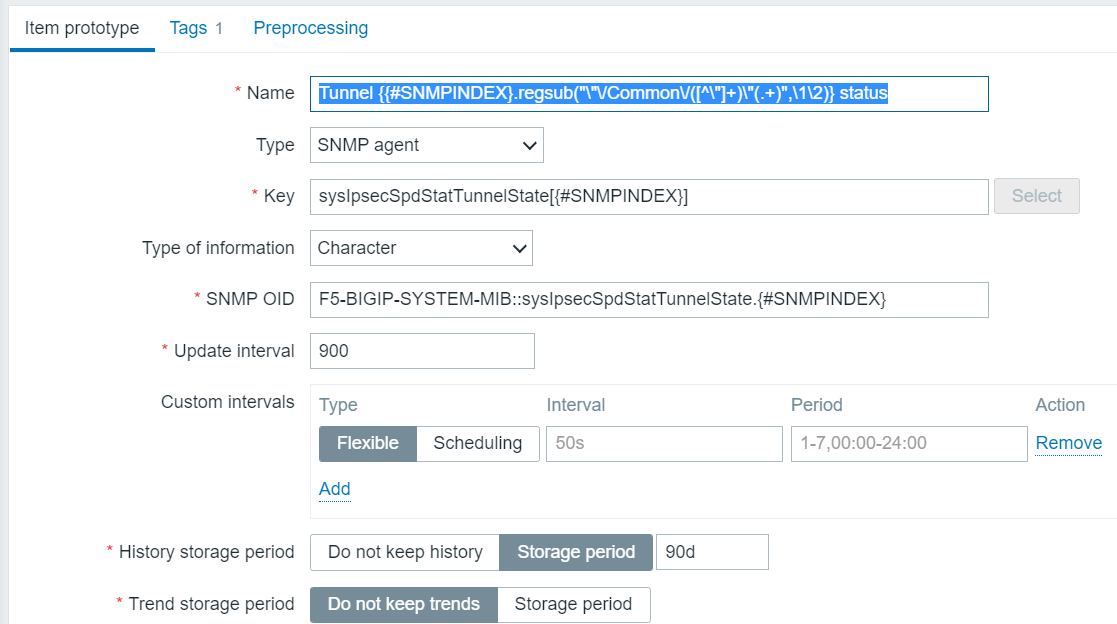
Tunnel Status Item prototype
So, yes, we’re doing some fancy regex to simplify the otherwise ungainly name which would be generated, stripping out the useless stuff with a regsub function, which, by the way, is poorly documented. So that’s how we’re going to discover the statuses of the tunnels. In text, the name is:
Tunnel {{#SNMPINDEX}.regsub(“\”\/Common\/([^\”]+)\”(.+)”,\1\2)} status
I learned how to choose the OID, which is the most critical part, I guess, from a combination of parsing the output of the snmpwalk plus imitation of those other LLD item prortypes, which were writtne by someone more competent than I.
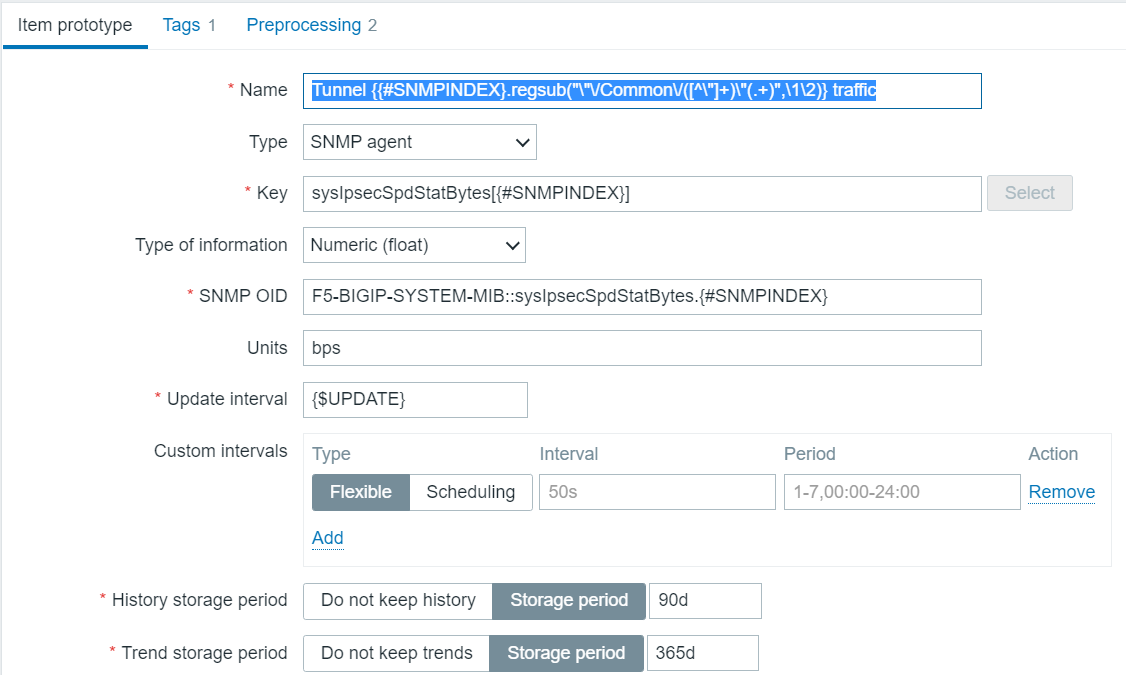
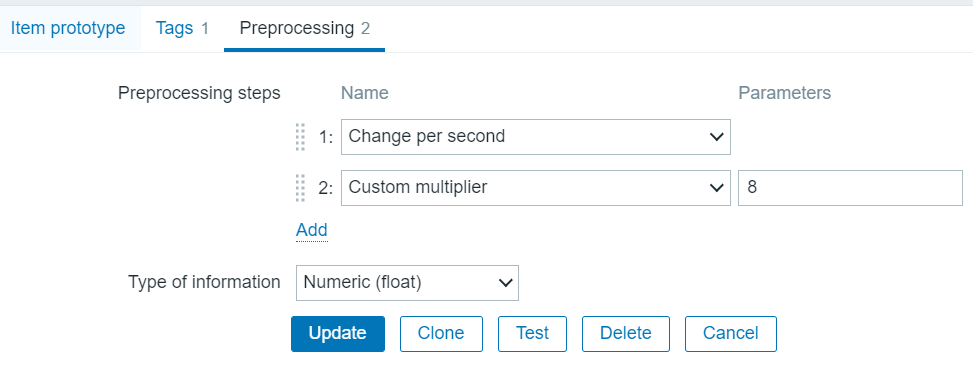
Now the SNMP value for traffic is bytes, but you see I set units of bps? I can do that because of the preprocessing steps which are
Bytes to traffic rate preprocessing steps
Final tip
For these discovery items what you want to do is to disable Create Enabled and disable Discover. I just run it on the F5s which actually have IPSEC tunnels. Execute now actually works and generates items pretty quickly.
Using the api with a token and security by obscurity
I am taking the approach of pulling the token out of a config file where it has been stored, base85 encoded, because, who uses base85, anyway? I call the following script encode.py:
import sys
from base64 import b85encode

s = sys.argv[1]
s_e = s.encode('utf-8')

s64 = b85encode(s_e)
print('s,s_e,s64',s,s_e,s64)
In my case I pull this encoded token from a config file, but to simplify, let’s say we got it from the command line. This is how that goes, and we use it to create the zapi object which can be used in any subsequent api calls. That is the key.
So it’s a few extra lines of code, but the cool thing is that it works. This should be good for version 5.4 and 6.0. Note that if you installed both py-zabbix and pyzabbix, your best bet may be to uninstall both and reinstall just pyzabbix. At least that was my experience going from user/pass to token-based authentication.
Convert DateAndTime SNMP output to human-readable format
Of course this is not very Zabbix-specific, as long as you realize that Zabbix produces the outer skin of the function:
function(value){
function (value) {
// DrJ 2020-05-04// see https://support.zabbix.com/browse/ZBXNEXT-3899 for SNMP DateAndTime format'use strict';//var str = "07 E4 05 04 0C 32 0F 00 2B 00 00";var str = value;// alert("str: " + str);// read values are hexvar y256 = str.slice(0,2);var y = str.slice(3,5);var m = str.slice(6,8);var d = str.slice(9,11);var h = str.slice(12,14);var min = str.slice(15,17);// convert to decimalvar y256Base10 =+("0x"+ y256);// convert to decimalvar yBase10 =+("0x"+ y);var Year =256*y256Base10 + yBase10;// alert("Year: " + Year);var mBase10 =+("0x"+ m);var dBase10 =+("0x"+ d);var hBase10 =+("0x"+ h);var minBase10 =+("0x"+ min);var YR =String(Year);var MM =String(mBase10);var DD =String(dBase10);var HH =String(hBase10);var MIN =String(minBase10);// paddingif(mBase10 <10) MM ="0"+ MM;if(dBase10 <10) DD ="0"+ DD;if(hBase10 <10) HH ="0"+ HH;if(minBase10 <10) MIN ="0"+ MIN;varDate= YR +"-"+ MM +"-"+ DD +" "+ HH +":"+ MIN;returnDate;
// DrJ 2020-05-04
// see https://support.zabbix.com/browse/ZBXNEXT-3899 for SNMP DateAndTime format
'use strict';
//var str = "07 E4 05 04 0C 32 0F 00 2B 00 00";
var str = value;
// alert("str: " + str);
// read values are hex
var y256 = str.slice(0,2); var y = str.slice(3,5); var m = str.slice(6,8);
var d = str.slice(9,11); var h = str.slice(12,14); var min = str.slice(15,17);
// convert to decimal
var y256Base10 = +("0x" + y256);
// convert to decimal
var yBase10 = +("0x" + y);
var Year = 256*y256Base10 + yBase10;
//  alert("Year: " + Year);
var mBase10 = +("0x" + m);
var dBase10 = +("0x" + d);
var hBase10 = +("0x" + h);
var minBase10 = +("0x" + min);
var YR = String(Year); var MM = String(mBase10); var DD = String(dBase10);
var HH = String(hBase10);
var MIN = String(minBase10);
// padding
if (mBase10 < 10)  MM = "0" + MM; if (dBase10 < 10) DD = "0" + DD;
if (hBase10 < 10) HH = "0" + HH; if (minBase10 < 10) MIN = "0" + MIN;
var Date = YR + "-" + MM + "-" + DD + " " + HH + ":" + MIN;
return Date;
I put that javascript into the preprocessing step of a dependent item, of course.
All my real-life examples do not fill in the last two fields: +/-, UTC offset. So in my case the times must be local times. But consequently I have no idea how a + or – would be represented in HEX! So I just ignored those last fields in the SNNMP DateAndTime which otherwise might have been useful.
Here’s an alternative version which calculates how long its been in hours since the last AV signature update.
// DrJ 2020-05-05// see https://support.zabbix.com/browse/ZBXNEXT-3899 for SNMP DateAndTime format'use strict';//var str = "07 E4 05 04 0C 32 0F 00 2B 00 00";var Start =newDate();var str = value;// alert("str: " + str);// read values are hexvar y256 = str.slice(0,2);var y = str.slice(3,5);var m = str.slice(6,8);var d = str.slice(9,11);var h = str.slice(12,14);var min = str.slice(15,17);// convert to decimalvar y256Base10 =+("0x"+ y256);// convert to decimalvar yBase10 =+("0x"+ y);var Year =256*y256Base10 + yBase10;// alert("Year: " + Year);var mBase10 =+("0x"+ m);var dBase10 =+("0x"+ d);var hBase10 =+("0x"+ h);var minBase10 =+("0x"+ min);var YR =String(Year);var MM =String(mBase10);var DD =String(dBase10);var HH =String(hBase10);var MIN =String(minBase10);var Sigdate =newDate(Year, mBase10 -1, dBase10,hBase10,minBase10);//difference in hoursvar difference =Math.trunc((Start - Sigdate)/1000/3600);return difference;
// DrJ 2020-05-05
// see https://support.zabbix.com/browse/ZBXNEXT-3899 for SNMP DateAndTime format
'use strict';
//var str = "07 E4 05 04 0C 32 0F 00 2B 00 00";
var Start = new Date();
var str = value;
// alert("str: " + str);
// read values are hex
var y256 = str.slice(0,2); var y = str.slice(3,5); var m = str.slice(6,8); var d = str.slice(9,11); var h = str.slice(12,14); var min = str.slice(15,17);
// convert to decimal
var y256Base10 = +("0x" + y256);
// convert to decimal
var yBase10 = +("0x" + y);
var Year = 256*y256Base10 + yBase10;
//  alert("Year: " + Year);
var mBase10 = +("0x" + m);
var dBase10 = +("0x" + d);
var hBase10 = +("0x" + h);
var minBase10 = +("0x" + min);
var YR = String(Year); var MM = String(mBase10); var DD = String(dBase10);
var HH = String(hBase10);
var MIN = String(minBase10);
var Sigdate = new Date(Year, mBase10 - 1, dBase10,hBase10,minBase10);
//difference in hours
var difference = Math.trunc((Start - Sigdate)/1000/3600);
return difference;
Calculated bandwidth from an interface that only provides byte count
Again in this example the assumption is you have an item, probably from SNMP, that lists the total inbound/outbound byte count of a network interface – hopefully stored as a 64-bit number to avoid frequent rollovers. But the quantity that really excites you is bandwidth, such as megabits per second.
Use a calculated item as in this example for Bluecoat ProxySG:
change(sgProxyInBytesCount)*8/1000000/300
change(sgProxyInBytesCount)*8/1000000/300
Give it type numeric, Units of mbps. sgProxyInBytesCount is the key for an SNMP monitor that uses OID
IF-MIB::ifHCInOctets.{$INTERFACE_TO_MEASURE}
IF-MIB::ifHCInOctets.{$INTERFACE_TO_MEASURE}
where {$INTERFACE_TO_MEASURE} is a macro set for each proxy with the SNMP-reported interface number that we want to pull the statistics for.
The 300 in the denominator of the calculated item is required for me because my item is run every five minutes.
Alternative
No one really cares about the actual total value of byte count, right? So just re-purpose the In Bytes Count item a bit as follows:
add preprocessing step: Change per second
add second preprocessing step, Custom multiplier 8e-6
The first step gives you units of bytes/second which is less interesting than mbps, which is given by the second step. So the final units are mbps.
Be sure to put the units as !mbps into the Zabbix item, or else you may wind up with funny things like Kmbps in your graphs!
Creating a baseline
Even as of Zabbix v 5, there is no built-in baseline item type, which kind of sucks. Baseline can mean many different things to many people – it really depends on the data. In the corporate world, where I’m looking at bandwidth, my data has these distinct characteristics:
varies by hour-of-day, e.g., mornings see heavier usage than afternoons
there is the “Friday effect” where somewhat less usage is seen on Fridays, and extremely less usage occurs on weekends, hence variability by day-of-week
probably varies by day of month, e.g., month-end closings
So for this type of data (except the last criterion) I have created an appropriate baseline. Note I would do something different if I were graphing something like the solar generation from my solar panels, where the day-of-week variability does not exist.
Getting to the point, I have created a rolling lookback item. This needs to be created as a Zabbix Item of type Calculated. The formula is as follows:
In this example sgProxyInBytesCount is my key from the reference item. Breaking it down, it does a rolling lookback of the last six measurements taken at this time of day on this day of the week over the last six weeks and averages them. Voila, baseline! The more weeks you include the more likely you are to include data you’d rather not like holidays, days when things were busted, etc. I’d like to have a baseline that is from a fixed time, like “all of last year.” I have no idea how. I actually don’t think it’s possible.
But, anyway, the baseline approach above should generally work for any numeric item.
Refinement
The above approach only gives you six measurements, hence 1/sqrt(6) ~ 40% standard deviation by the law of large numbers, which is still pretty jittery as it turns out. So I came up with this refined approach which includes 72 measurements, hence 1/sqrt(72) ~ 12% st dev. I find that to be closer to what you intuitively expect in a baseline – a smooth approximation of the past. Here is the refined function:
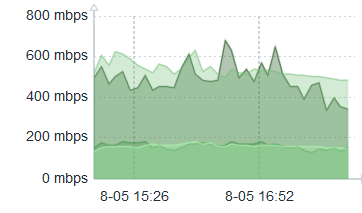
I would have preferred a one-hour interval centered around one week ago, etc., e.g., something like 1w+30m, but such date arithmetic does not seem possible in Zabbix functions. And, yeah, I could put 84600s (i.e., 86400 – 1800), but that is much less meaingful and so harder to maintain. Here is a three-hour graph whose first half still reflects the original (jittery) baseline, and last half the refined function.
Latter part has smoothed baseline in light green
What I do not have mastered is whether we can easily use a proper smoothing function. It does not seem to be a built-in offering of Zabbix. Perhaps it could be faked by a combination of pre-processing and Javascript? I simply don’t know, and it’s more than I wish to tackle for the moment.
Data gap between mulitple item measurements looks terrible in Dashboard graph – solution
In a Dashboard if you are graphing items which were not all measured at the same time, the results can be frustrating. For instance, an item and its baseline as calculated above. The central part of the graph will look fine, but at either end giant sections will be missing when the timescale of display is 30 minutes or 60 minutes for items measured every five minutes or so. Here’s an example before I got it totally fixed.
Zabbix item timing mismatch
See the left side – how it’s broken up? I had beguin my fix so the right side is OK.
The data gap solution
Use Scheduling Intervals in defining the items. Say you want a measurement every five minutes. Then make your scheduling interval m/5 in all the items you are putting on the same graph. For good measure, make the regular interval value infrequent. I use a macro {$UPDATE_LONG}. What this does is force Zabbix to measure all the items at the same time, in this case every five minutes on minutes divisible by five. Once I did that my incoming bandwith item and its corresponding baseline item aligned nicely.
Low-level Discovery
I cottoned on to the utility of this part of Zabbix a little late. Hey, slow learner, but I eventually got there. What I found in my F5 devices is that using SNMP to monitor the /var filesystem was a snap: it was always device 32 (final OID digit). But /var/log monitoring? Not so much. Every device seemed different, with no obvious pattern. Active and standby units – identical hardware – and some would be 53, the partner 55. Then I rebooted a device and its number changed! So, clearly, dynamically assigned and no way was I going to keep up with it. I had learned the numbers by doing an snmpwalk. The solution to this dynamically changing OID number is to use low-level discovery.
Tip: using zabbix_sender in a more robust fashion
We run the Zabbix proxies as pairs. They are not run as a cluster. Instead one is active and the other is a warm standby. Then we can upgrade at our leisure the standby proxy, switch the hosts to it, then upgrade the other now-unused proxy.
But our scripts which send results using zabbix_sender run on other servers. Their data stops being recorded when the switch is made. What to do?
I learned you can send to both Zabbix proxies. It will fail on the standby one and succeed on the other. Since one proxy is always active, it will always succeed in sending its data!
A nice DNS synthetic monitor
It would have been so easy for Zabbix to have built in the capability of doing synthetic DNS checks against your DNS servers. But, alas, they left it out. Which leaves it to us to fill that gap. Here is a nice and simple but surprisingly effective script for doing synthetic DNS checks. You put it in the external script directory of whatever proxy is monitoring your DNS host. I called it dns.sh.
#!/bin/sh
# arg1 - hostname of nameserver
# arg2 - DNS server to test
# arg3 - FQDN
# arg4 - RR type
# arg5 - match arg
# [arg6] - tcpflag # this argument is optional

# if you set DEBUG=1, and debug through zabbix, set item type to text
DEBUG=0
timeout=2 # secs - seems a good value
name=$1
nameserver=$2
record=$3
type=$4
match=$5
tcpflag=$6
[[ "$DEBUG" -eq "1" ]] && echo "name: $name, nameserver: $nameserver , record: $record , type: $type , match pattern: $match, tcpflag: $tcpflag"
[[ "$tcpflag" = "y" ]] || [[ "$tcpflag" = "Y" ]] && PROTO="+tcp"
# unless you set tries to 1 it will try three times by default!
MATCH=$(dig +short $PROTO +timeout=$timeout +tries=1 $type $record @${nameserver} )
[[ "$DEBUG" -eq "1" ]] && echo MATCHed line is $MATCH
return=0
[[ "$MATCH" =~ $match ]] && return=1
[[ "$DEBUG" -eq "1" ]] && echo return $return
echo $return
It gives a value of 1 if it matched the match expression, 0 otherwise.
Conclusion
A couple of really useful but poorly documented items are shared. Perhaps more will be added in the future.
Intro
All of a sudden one day I could not access the GUI of one my security appliances. It had only worked yesterday. CLI access kind of worked – until it didn’t. It was the standby part of a cluster so I tried the active unit. Same issues. I have some ill-defined involvement with the firewall the traffic was traversing, so I tried to debug the problem without success. So I brought in a real firewall expert.
More details
Of course I knew to check the firewall logs. Well, they showed this traffic (https and ssh) to have been accepted, no problems. Hmm. I suspected some weird IPS thing. IPS is kind of a big black box to me as I don’t deal with it. But I have seen cases where it blocks traffic without logging the fact. But that concern led me to bring in the expert.
By myself I had gotten it to the point where I had done tcpdump (I had totally forgotten how to use fw monitor. Now I will know and refer to my own recent blog post) on the corporate network side as well as the protected subnet side. And I saw that packets were hitting the corporate network interface that weren’t crossing over to the protected subnet. Why? But first some more about the symptoms.
The strange behaviour of my ssh session
The web GUI just would not load the home page. But ssh was a little different. I could indeed log in. But my ssh froze every time I changed to the /var/log directory and did a detailed directory listing ls -l. The beginning of the file listing would come back, and then just hang there mid-stream, frozen. In my tcpdump I noticed that the packets that did not get through were larger than the ones sent in the beginning of the session – by a lot. 1494 data bytes or something like that. So I could kind of see that with ssh, you normally send smallish packets, until you need a bigger one for something like a detailed directory listing! And https sends a large server certificate at the beginning of the session so it makes sense that it would hang if those packets were being stopped. So the observed behaviour makes sense in light of the dropping of the large packets. But that doesn’t explain why.
I asked a colleague to try it and they got similar results.
The solution method
It had nothing to do with IPS. The firewall guy noticed and did several things.
He agreed the firewall logs showed my connection being accepted.
He saw that another firewall admin had installed policy around the time the problem began. We analyzed what was changed and concluded that was a false lead. No way those changes could have caused this problem.
He switched the active firewall to standby so that we used the standby unit. It worked just fine!
He observed that the current active unit became active around the time of the problem, due to a problem with an interface on the normally active unit.
I probably would have been fine to just work using the standby but I didn’t want to crimp his style, so he continued in investigating…and found the ultimate root cause.
And finally the solution
He noticed that on the bad firewall the one interface – I swear I am not making this up – had been configured with a non-standard MTU! 1420 instead of 1500.
Analysis
I did a head slap when he shared that finding. Of course I should have looked for that. It explains everything. The OS was dropping the packet, not the firewall blade per se. And I knew the history. Some years back these firewalls were used for testing OLTV, a tunneling technology to extend layer 2 across physically separated subnets. That never did work to my satisfaction. One of the issues we encountered was a problem with large packets. So the firewall guy at the time tried this out to help. Normally firewalls don’t fail so the one unit where this MTU setting was present just wasn’t really used, except for brief moments during OS upgrade. And, funny to say, this mis-configuration was even propagated from older hardware to newer! The firewall guys have a procedure where they suck up all the configuration from the old firewall and restore to the newer one, mapping updated interface names, etc, as needed.
Well, at least we found it before too many others complained. Though, as expected, complain they did, the next day.
Aside: where is curl?
I normally would have tested the web page from the firewall iself using curl. But curl has disappeared from Gaia v 80.20. And there’s no wget either. How can such a useful and universal utility be missing? The firewall guy looked it up and quickly found that instead of curl, they have curl_cli. Who knew?
Conclusion
The strange case of the large packets dropped by a firewall, but not by the firewall blade, was resolved the same day it occurred. It took a partner ship of two people bringing their domain-specific knowledge to bear on the problem to arrive at the solution.
Intro
Scripts are normally not worth sharing because they are so easy to construct. This one illustrates several different concepts so may be of interest to someone else besides myself:
packet trace utility in Checkpoint firewall Gaia
send Ctrl-C interrupt to a process which has been run in the background
giving unqieu filenames for each cut
general approach to tacklnig the challenge of breaking a potentially large output into manageable chunks
The script
I wanted to learn about unexpected VPN client disconnects that a user, Sandy, was experiencing. Her external IP is 99.221.205.103.
while /bin/true; do
# date +%H%M inserts the current Hour (HH) and minute (MM).
 file=/tmp/sandy`date +%H%M`.cap
# fw monitor is better than tcpdump because it looks at all interfaces
 fw monitor -o $file -l 60 -e "accept src=99.221.205.103 or dst=99.221.205.103;" &
# $! picks up the process number of the command we backgrounded just above
 pid=$!
 sleep 600
 #sleep 90
 kill $pid
 sleep 3
 gzip $file
done
while /bin/true; do
# date +%H%M inserts the current Hour (HH) and minute (MM).
file=/tmp/sandy`date +%H%M`.cap
# fw monitor is better than tcpdump because it looks at all interfaces
fw monitor -o $file -l 60 -e "accept src=99.221.205.103 or dst=99.221.205.103;" &
# $! picks up the process number of the command we backgrounded just above
pid=$!
sleep 600
#sleep 90
kill $pid
sleep 3
gzip $file
done
This type of tracing of this VPN session produces about 20 MB of data every 10 minutes. I want to be able to easily share the trace file afterwards in an email. And smaller files will be faster when analyzed in Wireshark.
The script itself I run in the background:
# ./sandy.sh &
And to make sure I don’t get logged out, I just run a slow PING afterwards:
# ping ‐i45 1.1.1.1
Alternate approaches
In retrospect I could have simply used the -ci argument and had the process terminate itself after a certain number of packets were recorded, and saved myself the effort of killing that process. But oh well, it is what it is.
Small tip to see all packets
Turn acceleration off:
fwaccel stat
fwaccel off
fwaccel on (when you’re done).
Conclusion
I share a script I wrote today that is simple, but illustrates several useful concepts.
Intro
Wordpress tells me to upgrade to version 5.4. But when I try it says nope, your version of php is too old. Now admittedly, I’m running on an ancient CentOS server, now at version 6.10, which I set up back in 2012 I believe.
I’m pretty comfortable with CentOS so I wanted to continue with it, but just on a newer version at Amazon. I don’t like being taken advantage of, so I also wanted to avoid those outfits which charge by the hour for providing CentOS, which should really be free. Those costs can really add up.
Lots of travails setting up my AWS image, and then…
I managed to find a CentOS amongst the community images. I chose centos-8-minimal-install-201909262151 (ami-01b3337aae1959300).
OK. Brand new CentOS 8 image, 8.1.1911 after patching it, which will be supported for 10 years. Surely it has the latest and greatest??
But I didn’t see it until after I had done all the work below the hard way. Oh well.
When I install php I get version 7.2.11. WordPress is telling me I need a minimum of php version 7.3. If i download the latest php, it tells me to download the latest apache. So I do. Version 2.4.43. I also install gcc, anticipating some compiling in my future…
But apache won’t even configure:
httpd-2.4.43]$ ./configure --enable-so
checking for chosen layout... Apache
checking for working mkdir -p... yes
checking for grep that handles long lines and -e... /usr/bin/grep
checking for egrep... /usr/bin/grep -E
checking build system type... x86_64-pc-linux-gnu
checking host system type... x86_64-pc-linux-gnu
checking target system type... x86_64-pc-linux-gnu
configure:
configure: Configuring Apache Portable Runtime library...
configure:
checking for APR... no
configure: error: APR not found.  Please read the documentation.
httpd-2.4.43]$ ./configure --enable-so
checking for chosen layout... Apache
checking for working mkdir -p... yes
checking for grep that handles long lines and -e... /usr/bin/grep
checking for egrep... /usr/bin/grep -E
checking build system type... x86_64-pc-linux-gnu
checking host system type... x86_64-pc-linux-gnu
checking target system type... x86_64-pc-linux-gnu
configure:
configure: Configuring Apache Portable Runtime library...
configure:
checking for APR... no
configure: error: APR not found. Please read the documentation.
  --with-apr=PATH         prefix for installed APR or the full path to
                             apr-config
  --with-apr-util=PATH    prefix for installed APU or the full path to
                             apu-config

(apr-util configure)
checking for APR... no
configure: error: APR could not be located. Please use the --with-apr option.

try:

 ./configure --with-apr=/usr/local/apr

but

-D_GNU_SOURCE   -I/usr/local/src/apr-util-1.6.1/include -I/usr/local/src/apr-util-1.6.1/include/private  -I/usr/local/apr/include/apr-1    -o xml/apr_xml.lo -c xml/apr_xml.c && touch xml/apr_xml.lo
xml/apr_xml.c:35:10: fatal error: expat.h: No such file or directory
 #include
          ^~~~~~~~~
compilation terminated.
make[1]: *** [/usr/local/src/apr-util-1.6.1/build/rules.mk:206: xml/apr_xml.lo] Error 1
--with-apr=PATH prefix for installed APR or the full path to
apr-config
--with-apr-util=PATH prefix for installed APU or the full path to
apu-config
(apr-util configure)
checking for APR... no
configure: error: APR could not be located. Please use the --with-apr option.
try:
./configure --with-apr=/usr/local/apr
but
-D_GNU_SOURCE -I/usr/local/src/apr-util-1.6.1/include -I/usr/local/src/apr-util-1.6.1/include/private -I/usr/local/apr/include/apr-1 -o xml/apr_xml.lo -c xml/apr_xml.c && touch xml/apr_xml.lo
xml/apr_xml.c:35:10: fatal error: expat.h: No such file or directory
#include
^~~~~~~~~
compilation terminated.
make[1]: *** [/usr/local/src/apr-util-1.6.1/build/rules.mk:206: xml/apr_xml.lo] Error 1
So I install expat header files:
$ yum install expat-devel
And then the make of apr-util goes through. Not sure this is the right approach or not yet, however.
So following php’s advice, I have:
$ ./configure –enable-so
checking for chosen layout... Apache
...
checking for pcre-config... false
configure: error: pcre-config for libpcre not found. PCRE is required and available from http://pcre.org/
checking for chosen layout... Apache
...
checking for pcre-config... false
configure: error: pcre-config for libpcre not found. PCRE is required and available from http://pcre.org/
So I install pcre-devel:
$ yum install pcre-devel
Now the apache configure goes through, but the make does not work:
/usr/local/apr/build-1/libtool --silent --mode=link gcc  -g -O2 -pthread         -o htpasswd  htpasswd.lo passwd_common.lo       /usr/local/apr/lib/libaprutil-1.la /usr/local/apr/lib/libapr-1.la -lrt -lcrypt -lpthread -ldl -lcrypt
/usr/local/apr/lib/libaprutil-1.so: undefined reference to `XML_GetErrorCode'
/usr/local/apr/lib/libaprutil-1.so: undefined reference to `XML_SetEntityDeclHandler'
/usr/local/apr/lib/libaprutil-1.so: undefined reference to `XML_ParserCreate'
/usr/local/apr/lib/libaprutil-1.so: undefined reference to `XML_SetCharacterDataHandler'
/usr/local/apr/lib/libaprutil-1.so: undefined reference to `XML_ParserFree'
/usr/local/apr/lib/libaprutil-1.so: undefined reference to `XML_SetUserData'
/usr/local/apr/lib/libaprutil-1.so: undefined reference to `XML_StopParser'
/usr/local/apr/lib/libaprutil-1.so: undefined reference to `XML_Parse'
/usr/local/apr/lib/libaprutil-1.so: undefined reference to `XML_ErrorString'
/usr/local/apr/lib/libaprutil-1.so: undefined reference to `XML_SetElementHandler'
collect2: error: ld returned 1 exit status
make[2]: *** [Makefile:48: htpasswd] Error 1
/usr/local/apr/build-1/libtool --silent --mode=link gcc -g -O2 -pthread -o htpasswd htpasswd.lo passwd_common.lo /usr/local/apr/lib/libaprutil-1.la /usr/local/apr/lib/libapr-1.la -lrt -lcrypt -lpthread -ldl -lcrypt
/usr/local/apr/lib/libaprutil-1.so: undefined reference to `XML_GetErrorCode'
/usr/local/apr/lib/libaprutil-1.so: undefined reference to `XML_SetEntityDeclHandler'
/usr/local/apr/lib/libaprutil-1.so: undefined reference to `XML_ParserCreate'
/usr/local/apr/lib/libaprutil-1.so: undefined reference to `XML_SetCharacterDataHandler'
/usr/local/apr/lib/libaprutil-1.so: undefined reference to `XML_ParserFree'
/usr/local/apr/lib/libaprutil-1.so: undefined reference to `XML_SetUserData'
/usr/local/apr/lib/libaprutil-1.so: undefined reference to `XML_StopParser'
/usr/local/apr/lib/libaprutil-1.so: undefined reference to `XML_Parse'
/usr/local/apr/lib/libaprutil-1.so: undefined reference to `XML_ErrorString'
/usr/local/apr/lib/libaprutil-1.so: undefined reference to `XML_SetElementHandler'
collect2: error: ld returned 1 exit status
make[2]: *** [Makefile:48: htpasswd] Error 1
So I try configure or apr-util with expat built-in.
But when I do the make of apr-util I now get this error:
/usr/local/apr/build-1/libtool: line 7475: cd: builtin/lib: No such file or directory
libtool:   error: cannot determine absolute directory name of 'builtin/lib'
make[1]: *** [Makefile:93: libaprutil-1.la] Error 1
make[1]: Leaving directory '/usr/local/src/apr-util-1.6.1'
make: *** [/usr/local/src/apr-util-1.6.1/build/rules.mk:118: all-recursive] Error 1
From what I read this new error occurs due to having –expat-built-in! So now what? So I get rid of that in my configure statement for apr-util. For some reason, apr-util goes through and compiles. And so I try this for compiling apache24:
$ ./configure –enable-so –with-apr=/usr/local/apr
And then I make it. And for some reason, now it goes through. I doubt it will work, however… it kind of does work.
It threw the files into /usr/local/apache2, where there is a bin directory containing apachectl. I can launch apachectl start, and then access a default page on port 80. Not bad so far…
Hey, maybe for once their instructions will work. Nope.
configure: error: Package requirements (libxml-2.0 >= 2.7.6) were not met:

Package 'libxml-2.0', required by 'virtual:world', not found

Consider adjusting the PKG_CONFIG_PATH environment variable if you
installed software in a non-standard prefix.
So I guess I need to install libxml2-devel:
$ yum install libxm2-devel
Looks like I get past that error. Now it’s on to this one:
configure: error: Package requirements (sqlite3 > 3.7.4) were not met:
So I install sqlite-devel:
$ yum install sqlite-devel
Now my configure almost goes through, except, as I suspected, that was a nonsense argument:
It’s not there when you look for it! Why the heck did they – php.net – give an example with exactly that?? Annoying. So I leave it out. It goes through. Run make. It takes a long time to compile php! And this server is pretty fast. It’s slower than apache or anything else I’ve compiled.
But eventually the compile finished. It added a LoadModule statement to the apache httpd.conf file. And, after I associated files with php extension to the php handler, a test file seemed to work. So php is beginning to work. Not at all sure about the mysql tie-in, however. In fact see further down below where I confirm my fears that there is no MySQL support when PHP is compiled this way.
Is running SSL asking too much?
Apparently, yes. I don’t think my apache24 has SSL support built-in:
Invalid command 'SSLCipherSuite', perhaps misspelled or defined by a module not included in the server configuration
Invalid command 'SSLCipherSuite', perhaps misspelled or defined by a module not included in the server configuration
So I try
$ ./configure –enable-so –with-apr=/usr/local/apr –enable-ssl
Not good…
checking for OpenSSL... checking for user-provided OpenSSL base directory... none
checking for OpenSSL version >= 0.9.8a... FAILED
configure: WARNING: OpenSSL version is too old
no
checking whether to enable mod_ssl... configure: error: mod_ssl has been requested but can not be built due to prerequisite failures
Where is it pulling that old version of openssl? Cause when I do this:
$ openssl version
OpenSSL 1.1.1c FIPS 28 May 2019
OpenSSL 1.1.1c FIPS 28 May 2019
That’s not that old…
I also noticed this error:
configure: WARNING: Your APR does not include SSL/EVP support. To enable it: configure --with-crypto
So maybe I will re-compile APR with that argument.
Nope. APR doesn’t even have that argument. But apr-uil does. I’ll try that.
Not so good:
configure: error: Crypto was requested but no crypto library could be enabled; specify the location of a crypto library using --with-openssl, --with-nss, and/or --with-commoncrypto.
I give up. maybe it was a false alarm. I’ll try to ignore it.
This time at least the configure goes through – no ssl-related errors.
I needed to add the Loadmodule statement by hand to httpd.conf since that file was already there from my previous build and so did not get that statement after my re-build with ssl support:
LoadModule ssl_module modules/mod_ssl.so
LoadModule ssl_module modules/mod_ssl.so
Next error please
Now I have this error:
AH00526: Syntax error on line 92 of /usr/local/apache2/conf/extra/drjohns.conf:
SSLSessionCache: 'shmcb' session cache not supported (known names: ). Maybe you need to load the appropriate socache module (mod_socache_shmcb?).
AH00526: Syntax error on line 92 of /usr/local/apache2/conf/extra/drjohns.conf:
SSLSessionCache: 'shmcb' session cache not supported (known names: ). Maybe you need to load the appropriate socache module (mod_socache_shmcb?).
I want results. So I just comment out the lines that talk about SSL Cache and anything to do with SSL cache.
And…it starts…and…it is listening on both ports 80 and 443 and…it is running SSL. So I think i cracked the SSL issue.
Switch focus to Mysql
I didn’t bother to find mysql. I believe people now use mariadb. So I installed the system one with a yum install mariadb. I became root and learned the version with a select version();
+-----------------+
| version()       |
+-----------------+
| 10.3.17-MariaDB |
+-----------------+
1 row in set (0.000 sec)
+-----------------+
| version() |
+-----------------+
| 10.3.17-MariaDB |
+-----------------+
1 row in set (0.000 sec)
Is that recent enough? Yes! For once we skate by comfortably. The WordPress instructions say:
MySQL 5.6 or MariaDB 10.1 or greater
I setup apache. I try to access wordpress setup but instead get this message:
Forbidden

You don't have permission to access this resource.
Forbidden
You don't have permission to access this resource.
every page I try gives this error.
The apache error log says:
client denied by server configuration: /usr/local/apache2/htdocs/
client denied by server configuration: /usr/local/apache2/htdocs/
Not sure where that’s coming from. I thought I supplied my own documentroot statements, etc.
I threw in a Require all granted within the Directory statement and that seemed to help.
PHP/MySQL communication issue surfaces
Next problem is that PHP wasn’t compiled correctly it seems:
Your PHP installation appears to be missing the MySQL extension which is required by WordPress.
Your PHP installation appears to be missing the MySQL extension which is required by WordPress.
So I’ll try to re-do it. This time I am trying these arguments to configure:
$ ./configure ‐‐with-apxs2=/usr/local/apache2/bin/apxs ‐‐with-mysqli
Well, I’m not so sure this worked. Trying to setup WordPress, I access wp-config.php and only get:
Error establishing a database connection
Error establishing a database connection
This is roll up your sleeves time. It’s clear we are getting no breaks. I looked into installing PhpMyAdmin, but then I would neeed composer, which may depend on other things, so I lost interest in that rabbit hole. So I decide to simplify the problem. The suggested test is to write a php program like this, which I do, calling it tst2.php:
PHP Warning:  mysqli_connect(): (HY000/2002): No such file or directory in /web/drjohns/blog/tst2.php on line 7

Warning: mysqli_connect(): (HY000/2002): No such file or directory in /web/drjohns/blog/tst2.php on line 7
PHP Warning: mysqli_connect(): (HY000/2002): No such file or directory in /web/drjohns/blog/tst2.php on line 7
Warning: mysqli_connect(): (HY000/2002): No such file or directory in /web/drjohns/blog/tst2.php on line 7
Some quick research tells me that php does not know where the file mysql.sock is to be found. I search for it:
$ sudo find / ‐name mysql.sock
and it comes back as
/var/lib/mysql/mysql.sock
/var/lib/mysql/mysql.sock
So…the prescription is to update a couple things in pph.ini, which has been put into /usr/local/lib in my case because I compiled php with mostly default values. I add the locatipon of the mysql.sock file in two places for good measure:
Install WordPress
I begin to install WordPress, creating an initial user and so on. When I go back in I get a directory listing in place of the index.php. So I call index.php by hand and get a worisome error:
Fatal error: Uncaught Error: Call to undefined function gzinflate() in /web/drjohns/blog/wp-includes/class-requests.php:947 Stack trace: #0 /web/drjohns/blog/wp-includes/class-requests.php(886): Requests::compatible_gzinflate('\xA5\x92\xCDn\x830\f\x80\xDF\xC5g\x08\xD5\xD6\xEE...'
Fatal error: Uncaught Error: Call to undefined function gzinflate() in /web/drjohns/blog/wp-includes/class-requests.php:947 Stack trace: #0 /web/drjohns/blog/wp-includes/class-requests.php(886): Requests::compatible_gzinflate('\xA5\x92\xCDn\x830\f\x80\xDF\xC5g\x08\xD5\xD6\xEE...'
I should have compiled php with zlib is what I determine it means… zlib and zlib-devel packages are on my system so this should be straightforward.
More arguments for php compiling
OK. Let’s be sensible and try to reproduce what I had done in 2017 to compile php instead of finding an resolving mistakes one at a time.
Package 'libcurl', required by 'virtual:world', not found
I will install libcurl-devel in hopes of making this one go away.
Past that error, and onto this one:
configure: error: DBA: Could not find necessary header file(s).
I’m trying to drop the –with-gdbm and skip that whole DBA thing since the database connection seemed to be working without it. Now I see an openssl problem:
make: *** No rule to make target '/tmp/php-7.4.4/ext/openssl/openssl.c', needed by 'ext/openssl/openssl.lo'. Stop.
make: *** No rule to make target '/tmp/php-7.4.4/ext/openssl/openssl.c', needed by 'ext/openssl/openssl.lo'. Stop.
Even if I get rid of openssl I still see a problem when running configure:
gawk: ./build/print_include.awk:1: fatal: cannot open file `ext/zlib/*.h*' for reading (No such file or directory)
gawk: ./build/print_include.awk:1: fatal: cannot open file `ext/zlib/*.h*' for reading (No such file or directory)
Now I can ignore that error because configure exits with 0 status and make, but the make then stops at zlib:
SIGNALS   -c /tmp/php-7.4.4/ext/sqlite3/sqlite3.c -o ext/sqlite3/sqlite3.lo
make: *** No rule to make target '/tmp/php-7.4.4/ext/zlib/zlib.c', needed by 'ext/zlib/zlib.lo'.  Stop.
SIGNALS -c /tmp/php-7.4.4/ext/sqlite3/sqlite3.c -o ext/sqlite3/sqlite3.lo
make: *** No rule to make target '/tmp/php-7.4.4/ext/zlib/zlib.c', needed by 'ext/zlib/zlib.lo'. Stop.
Reason for above php compilation errors
I figured it out. My bad. I had done a make distclean in addition to a make clean when i was re-starting with a new set of arguments to configure. i saw it somewhere advised on the Internet and didn’t pay much attention, but it seemed like a good idea. But I think what it was doing was wiping out the files in the ext directory, like ext/zlib.
So now I’m starting over, now with php 7.4.5 since they’ve upgraded in the meanwhile! With this configure command line (I figure I probably don’t need gdb):
./configure –with-apxs2=/usr/local/apache2/bin/apxs –with-mysqli –disable-cgi –with-zlib –with-gettext –with-gdbm –with-curl –with-openssl
Well, the php compile went through, however, I can’t seem to access any WordPress pages (all WordPress pages clock). Yet my simplistic database connection test does work. Hmmm. OK. If they come up at all, they come up exceedingly slowly and without correct formatting.
I think I see the reason for that as well. The source of the wp-login.php page (as viewed in a browser window) includes references to former hostnames my server used to have. Of course fetching all those objects times out. And they’re the ones that provide the formatting. At this point I’m not sure where those references came from. Not from the filesystem, so must be in the database as a result of an earlier WordPress install attempt. Amazon keeps changing my IP, you see. I see it is embedded into WordPress. In Settings | general Settings. I’m going to have this problem every time…
What I’m going to do is to create a temporary fictitious name, johnstechtalk, which I will enter in my hosts file on my Windows PC, in Windows\system32\drivers\etc\hosts, and also enter that name in WordPress’s settings. I will update the IP in my hosts file every time it changes while I am playing around. And now there’s even an issue doing this which has always worked so reliably in the past. Well, I found I actually needed to override the IP for drjohnstechtalk.com in my hosts file. But it seems Firefox has moved on to using DNS over https, so it ignores the hosts file now! i think. Edge still uses it however, thankfully.
WordPress
So WordPress is basically functioning. I managed to install a few of my fav plugins: Akismet anti-spam, Limit Login Attempts, WP-PostViews. Some of the plugins are so old they actually require ftp. Who runs ftp these days? That’s been considered insecure for many years. But to accommodate I installed vsftpd on my server and ran it, temporarily.
Then Mcafee on my PC decided that wordpress.org is an unsafe site, thank you very much, without any logs or pop-ups. I couldn’t reach that site until I disabled the Mcafee firewall. Makes it hard to learn how to do the next steps of the upgrade.
More WordPress difficulties
WordPress is never satisfied with whatever version you’ve installed. You take the latest and two weeks later it’s demanding you upgrade already. My first upgrade didn’t go so well. Then I installed vsftpd. The upgrade likes to use your local FTP server – at least in my case. so for ftp server I just put in 127.0.0.1. Kind of weird. Even still I get this error:
Downloading update from https://downloads.wordpress.org/release/wordpress-5.4.2-no-content.zip…

The authenticity of wordpress-5.4.2-no-content.zip could not be verified as no signature was found.

Unpacking the update…

Could not create directory.

Installation Failed
So I decided it was a permissions problem: my apache was running as user daemon (do a ps -ef to see running processes), while my wordpress blog directory was owned by centos. So I now run apache as user:group centos:centos. In case this helps anyone the apache configurtion commands to do this are:
User centos
Group centos
then I go to my blog directory and run something like:
chown -R centos:centos *
Wordpres Block editor non-functional after the upgrade
When I did the SQL import from my old site, I killed the block editor on my new site! This was disconcerting. That little plus sign just would not show up on new pages, no posts, whatever. So I basically killed wordpress 5.4. So I took a step backwards and started v 5.4 with a clean (empty) database like a fresh install to make sure the block editor works then. It did. Whew! Then I did an RTFM and deactivated my plugins on my old WordPress install before doing the mysql backup. I imported that SQL database, with a very minimal set of plugins activated, and, whew, this time I did not blow away the block editor.
CentOS bogs down
I like my snappy new Centos 8 AMI 80% of the time. But that remaining 20% is very annoying. It freezes. Really bad. I ran a top until the problem happened. Here I’ve caught the problem in action:
top - 16:26:11 up 1 day, 21 min, 2 users, load average: 3.96, 2.93, 5.30
Tasks: 95 total, 1 running, 94 sleeping, 0 stopped, 0 zombie
%Cpu(s): 0.1 us, 2.6 sy, 0.0 ni, 0.0 id, 95.8 wa, 0.4 hi, 0.3 si, 0.7 st
MiB Mem : 1827.1 total, 63.4 free, 1709.8 used, 53.9 buff/cache
MiB Swap: 0.0 total, 0.0 free, 0.0 used. 9.1 avail Mem

PID USER PR NI VIRT RES SHR S %CPU %MEM TIME+ COMMAND
44 root 20 0 0 0 0 S 1.6 0.0 12:47.94 kswapd0
438 root 0 -20 0 0 0 I 0.5 0.0 1:38.84 kworker/0:1H-kblockd
890 mysql 20 0 1301064 92972 0 S 0.4 5.0 1:26.83 mysqld
5282 centos 20 0 1504524 341188 64 S 0.4 18.2 0:06.06 httpd
5344 root 20 0 345936 1008 0 S 0.4 0.1 0:00.09 sudo
560 root 20 0 93504 6436 3340 S 0.2 0.3 0:02.53 systemd-journal
712 polkitd 20 0 1626824 4996 0 S 0.2 0.3 0:00.15 polkitd
817 root 20 0 598816 4424 0 S 0.2 0.2 0:12.62 NetworkManager
821 root 20 0 634088 14772 0 S 0.2 0.8 0:18.67 tuned
1148 root 20 0 216948 7180 3456 S 0.2 0.4 0:16.74 rsyslogd
2346 john 20 0 273640 776 0 R 0.2 0.0 1:20.73 top
1 root 20 0 178656 4300 0 S 0.0 0.2 0:11.34 systemd
So what jumps out at me is the 95.8% wait time – that ain’t good – an that a process which includes the name swap is at the top of ths list, combined with the fact that exactly 0 swap space is allocated. My linux skills may be 15 years out-of-date, but I think I better allocate some swap space (but why does it need it so badly??). On my old system I think I had done it. I’m a little scared to proceed for fear of blowing up my system.
So if you use drjohnstechtalk.com and it freezes, just come back in 10 minutes and it’ll probably be running again – this situation tends to self-correct. No one’s perfect.
Some of the commands are dd to create an empty file, mkswap, swapon and swapon -s to see what it’s doing. And it really, really helped. I think sometimes mariadb needed to swap, and sometimes apache did. My system only has 1.8 GB of memory or so. And the drive is solid state, so it should be kind of fast. Because I used 1.2 GB for swap, I also extended my volume size when I happened upon Amazon’s clear instructions on how you can do that. Who knew? See below for more on that. If I got it right, Amazon also gives you more IO for each GB you add. I’m definitely getting good response after this swap space addition.
An aside about i/o
In the old days I perfected a way to study i/o using the iostat utility. You can get it by installing the sysstat package. A good command to run is iostat -t -c -m -x 5
Examing these three consecutive lines of output from running that command is very instructional:
I tooled around in the admin panel (which previously had brought my server to its knees), and you see the %util shot up to 90%, reads per sec over 2000 , writes per second 1400. So, really demanding. It’s clear my server would die if more than a few people were hitting it hard. And I may need some fine-tuning.
Success!
Given all the above problems, you probably never thought I’d pull this off. I worked in fits and starts – mostly when my significant other was away because this stuff is a time suck. But, believe it or not, I got the new apache/openssl/apr/php/mariadb/wordpress/centos/amazon EC2 VPC/drjohnstechtalk-with-new-2020-theme working to my satisfaction. I have to pat myself on the back for that. So I pulled the plug on the old site, which basically means moving the elastic IP over from old centos 6 site to new centos8 AWS instance. Since my site was so old, I had to first convert the elastic IP from type classic to VPC. It was not too obvious, but I got it eventually.
Damn hackers already at it
Look at the access log of your new apache server running your production WordPress. If you see like I did people already trying to log in (POST accesses for …/wp-login.php), which is really annoying because they’re all hackers, at least install the WPS Hide Login plugin and configure a secret login URL. Don’t use the default login.
Meanwhile I’ve decided to freeze out anyone who triess to access wp-login.php because they can only be up to no good. So I created this script which I call wp-login-freeze.sh:
#!/bin/sh
# freeze hackers who probe for wp-login
# DrJ 6/2020
DIR=/var/log/drjohns
cd $DIR
while /bin/true; do
tail -200 access_log|grep wp-login.php|awk '{print $1}'|sort -u|while read line; do
echo $line
route add -host $line reject
done
sleep 60
done
Works great! Just do a netstat -rn to watch your ever-growing list of systems you’ve frozen out.
But xmlrpc is the worst…
Bots which invoke xmlrpc.php are the worst for little servers like mine. They absolutely bring it to its knees. So I’ve just added something similar to the wp-login freeze above, except it catches xmlrpc bots:
#!/bin/sh
# freeze hackers who are doing God knows what to xmlrpc.php
# DrJ 8/2020
DIR=/var/log/drjohns
cd $DIR
while /bin/true; do
# example offending line:
# 181.214.107.40 - - [21/Aug/2020:08:17:01 -0400] "POST /blog//xmlrpc.php HTTP/1.1" 200 401
tail -100 access_log|grep xmlrpc.php|grep POST|awk '{print $1}'|sort -u|while read line; do
echo $line
route add -host $line reject
done
sleep 30
done
I was still dissatisfied with seeing bots hit me up for 30 seconds or so, so I decided heck with it, I’m going to waste their time first. So I added a few lines to xmlrpc.php (I know you shouldn’t do this, but hackers shouldn’t do what they do either):
// DrJ improvements
if ($_SERVER['REQUEST_METHOD'] === 'POST') {
// just make bot suffer a bit... the freeze out is done by an external script
   sleep(25);
    //
}
// end DrJ enhancements
This freeze out trick within xmlrpc.php was only going to work if the bots run single-threaded, that is, they run serially, waiting for one request to finish before sending the next. I’ve been running it for a couple days and have enthusiasitically frozen out a few IPs. I can attest that the bots do indeed run single-threaded. So I typically get two entries in my access file to xmlrpc from a given bot, and then the bot is completely frozen out by the loopback route which gets added.
Mid-term issues discovered months later
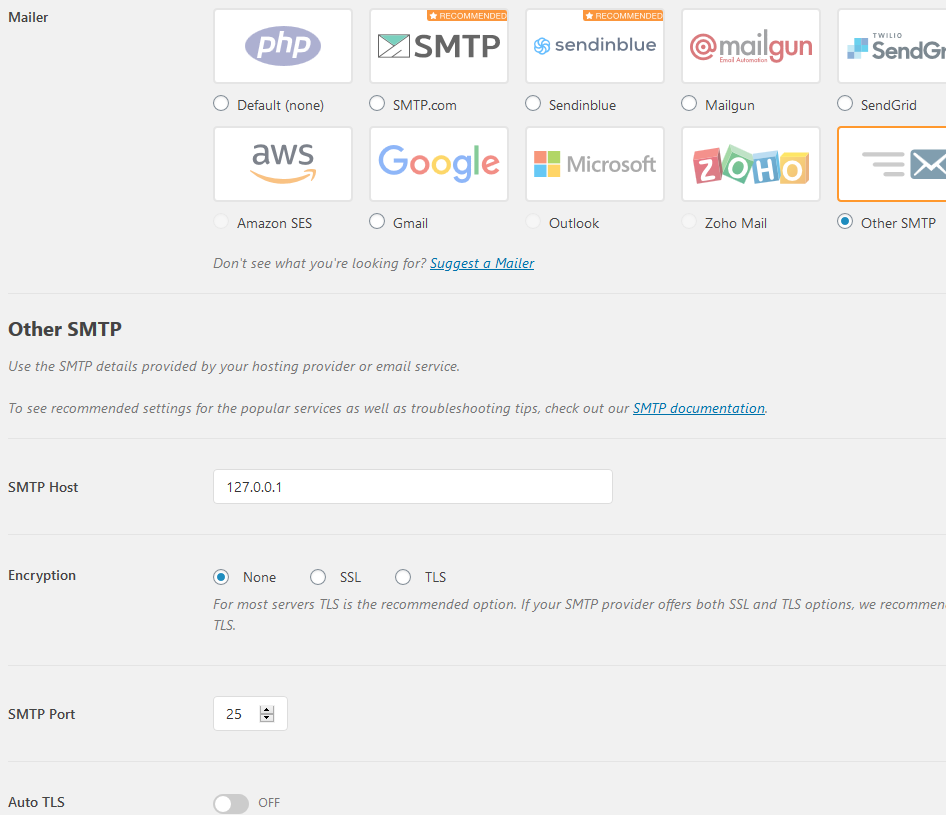
Well, I never needed to send emails form my server, until I did. And when I did I found I couldn’t. It used to work from my old server… From reading a bit I see WordPress uses PHP’s built-in mail() function, which has its limits. But my server did not have mailx or postfix packages. So I did a
$ yum install postfix mailx
$ systemctl enable postfix
$ systemctl start postfix
That still didn’t magically make WordPress mail work, although at that point I could send mail by hand frmo a spoofed address, which is pretty cool, like:
Well, wouldn’t you know my friend’s WordPress site I was trying to host brought my server to its knees. Again. Seems to be a common theme. I was hoping it was merely hackers who’d discovered his new site and injected it with the xmlrpc DOS because that would have been easy to treat. But no, no xmlrpc issues so far according to the access_log file. He uses more of the popular plugins like Elementor and Ninja Forms. Well, that Ninja Forms Dashboard is a killer. Reliably brings my server to a crawl. I even caught it in action from a running top and saw swap was the leading cpu-consuming process. And my 1.2 GB swap file was nearly full. So I created a second, larger swap file of 2 GB and did a swapon for that. Then I decommissioned my older swap file. Did you know you can do a swapoff? Yup. I could see the old one descreasing in size and the new one building up. And now the new one is larger than the old ever could be – 1.4 GB. Now Ninja forms dashboard can be launched. Performance is once again OK.
So…hosting second WordPress site now resolved.
Updating failed. The response is not a valid JSON response.
So then he got that error after enabling permalinks. The causes for this are pretty well documented. We took the standard advice and disabled all plugins. Wihtout permalinks we were fine. With them JSON error. I put the .htaccess file in place. Still no go. So unlike most advice, in my case, where I run my own web server, I must have goofed up the config and not enabled reading of the .htaccess file. Fortunately I had a working example in the form of my own blog site. I put all those apache commands which normally go into .htaccess into the vhost config file. All good.
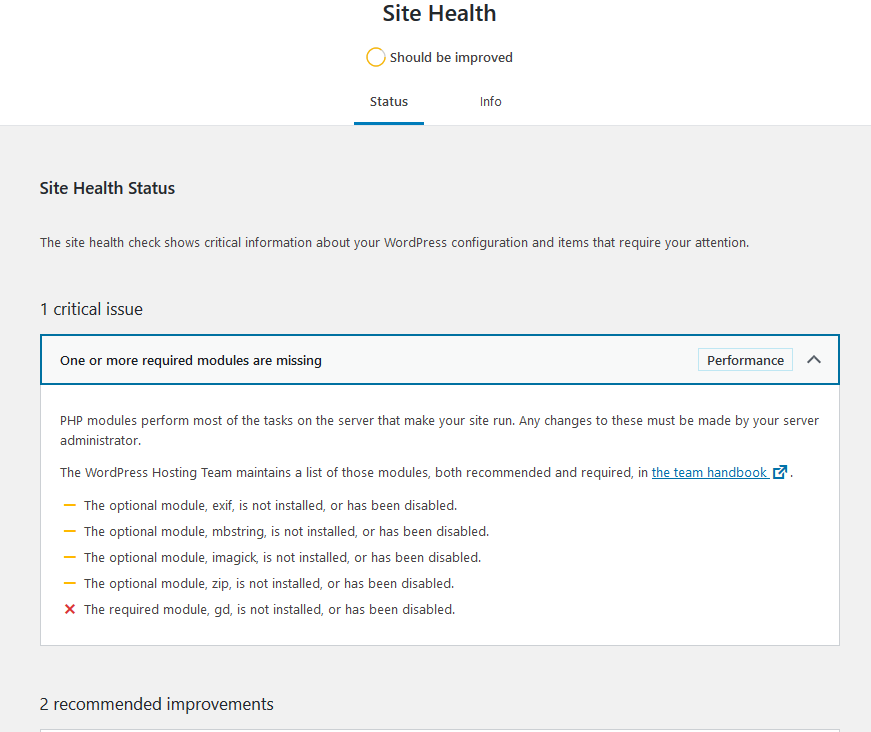
Although my site seems to be humming alnog, now I have to find the more obscure errors. WordPress mentioned my site health has problems.
WordPress site health
I think gd is used for graphics. I haven’t seen any negative results from this, yet. I may leave it be for the time being.
Lets Encrypt certificate renewal stops working
This one is at the bottom because it only manifests itself after a couple months – when the web site certificate either expires or is about to expire. Remember, this is a new server. I was lazy, of course, and just brought over the .acme.sh from the old server, hoping for the best. I didn’t notice any errors at first, but I eventually observed that my certificate was not getting renewed either even though it had only a few days of validity left.
To see what’s going on I ran this command by hand:
acme.sh new-authz error: {"type":"urn:acme:error:badNonce","detail":"JWS has no anti-replay nonce","status": 400}
seemed to be the most important error I noticed. The general suggestion for this is an acme.sh –upgrade, which I did run. But the nonce error persisted. It tries 20 times then gives up.
— warning: I know enough to get the job done, but not enough to write the code. Proceed at your own risk —
I read some of my old blogs and played with the command
My Webroot is /web/drjohns by the way. Now at least there was an error I could understand. I saw it trying to access something like http://drjohnstechtalk.com/.well-known/acme-challenge/askdjhaskjh
which produced a 404 Not Found error. Note the http and not https. Well, I hadn’t put much energy into setting up my http server. In fact it even has a different webroot. So what I did was to make a symbolic link
ln -s /web/drjohns/.well-known /web/insecure
I re-ran the acme.sh –issue command and…it worked. Maybe if I had issued a –renew it would not have bothered using the http server at all, but I didn’t see that switch at the time. So in my crontab instead of how you’re supposed to do it, I’m trying it with these two lines:
# Not how you're supposed to do it, but it worked once for me - DrJ 8/16/20
22 2 * * * "/root/.acme.sh"/acme.sh --issue -d drjohnstechtalk.com -w /web/drjohns > /dev/null 2>&1
22 3 16 * * "/root/.acme.sh"/acme.sh --update-account --issue -d drjohnstechtalk.com -w /web/drjohns > /dev/null 2>&1
The update-account is just for good measure so I don’t run into an account expiry problem which I’ve faced in the past. No idea if it’s really needed. Actually my whole approach is a kludge. But it worked. In two months’ time I’ll know if the cron automation also works.
Why kludge it? I could have spent hours and hours trying to get acme.sh to work as it was intended. I suppose with enough persistence I would have found the root problem.
2021 update. In retrospect
In retrospect, I think I’ll try Amazon Linux next time! I had the opportunity to use it for my job and I have to say it was pretty easy to set up a web server which included php and MariaDB. It feels like it’s based on Redhat, which I’m most familiar with. It doesn’t cost extra. It runs on the same small size on AWS. Oh well.
2022 update
I’m really sick of how far behind Redhat is with their provided software. And since they’ve been taken over by IBM, how they’ve killed CentOS is scandalous. So I’m inclined to go to a Debian-based system for my next go-around, which is much more imminent than I ever expected it to be thanks to the discontinuation of support for CentOS. I asked someone who hosts a lot of WP sites and he said he’d use Ubuntu server 22, PHP 8, MariaDB and NGinx. Boy. Guess I’m way behind. He says performance with PHP 8 is much better. I’ve always used apache but I guess I don’t really rely on it for too many fancy features.
Intro
This is pretty esoteric, but I’ve personally been waiting for this for a long time. It seems that beginning with openssl 1.1, the s_client sub-menu has had support for a proxy setting. Until then it was basically impossible to examine the certificates your proxy was sending back to users.
Why is it a great thing? If your proxy does SSL interception then it is interfering with with the site’s normal certificate. And worse, it can good. What if its own signing certificate has expired?? I’ve seen it happen, and it isn’t pretty…
To find the openssl version just run openssl version.
My SLES12 SP4 servers have a version which is too old. My Cygwin install is OK, actually. My Redhat 7.7 has a version which is too old. I do have a SLES 15 server which has a good version. But even the version on my F5 devices is too old, surprisingly.
Setup
I decided to run an X Server on my Windows 10 laptop. I only need it for Cognos gateway configuration, but when you need it, you need it. Of course an X Server listens on port 6000, so hosts outside of your PC have to be able to initiate a TCP connection to your PC with destination port 6000. So that port has to be open. The software I use for the X Server is Mobatek XTerm.
Here is the Powershell command to disable the block of TCP port 6000.
The Powershell window needs to be run as administrator. The change is permanent: it suffices to run it once.
Conclusion
And, because inquiring minds want to know, did it work? Yes, it worked and I could send my cogconfig X window to my Mobatek X Server. I had to look for a new Window. It was slow.
Intro
I panned Zabbix in this post: DIY monitoring. But I have compelling reasons to revisit it. I have to say it has matured, but there remain some very frustrating things about it, especially when compared with SiteScope (now owned by Microfocus) which is so much more intuitive.
But I am impressed by the breadth of the user base and the documentation. But learning how to do any specific thing is still an exercise in futility.
I am going to try to structure this post as a problems encountered, and how they were resolved.
Current production version as of this writing? Answer: 6.0
Zabbix Manual does not work in Firefox
That’s right. I can’t even read the manual in my version of Firefox. Its sections do not expand. Solution: use Chrome
Which database?
You may see references to MYSQL in Zabbix docs. MYSQL is basically dead. what should you do?
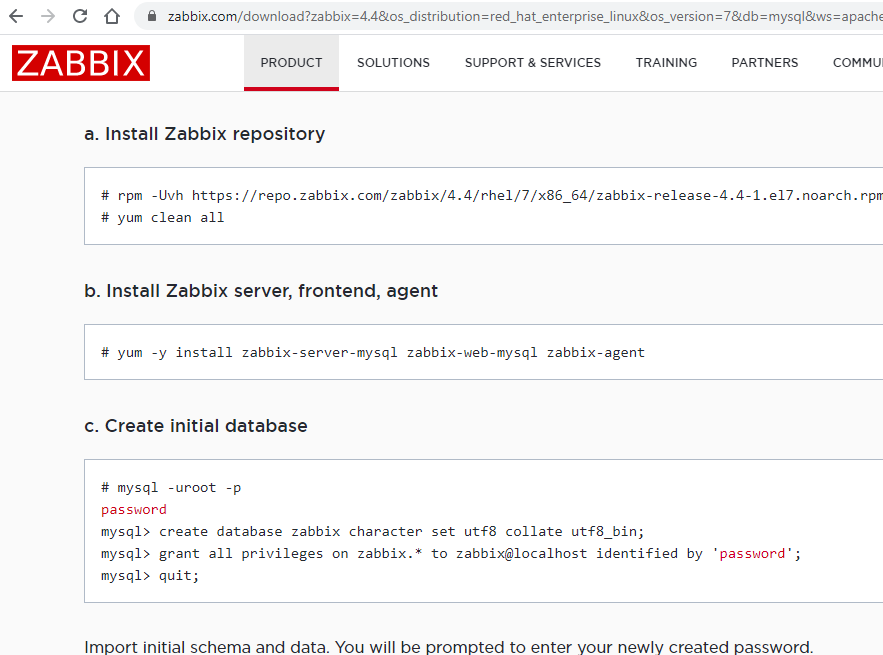
Zabbix quick install on Redhat
Answer
Install mariadb which has replaced MYSQL and supports the same commands such as the mysql from the screenshot. On my Redhat instance I have installed these mariadb-related repositories:
Terminology confusion
what is a host, a host group, a template, an item, a web scenario, a trigger, a media type?
Answer
Don’t ask me. When I make progress I’ll post it here.
Web scenario specific issues
Can different web scenarios use different proxies?
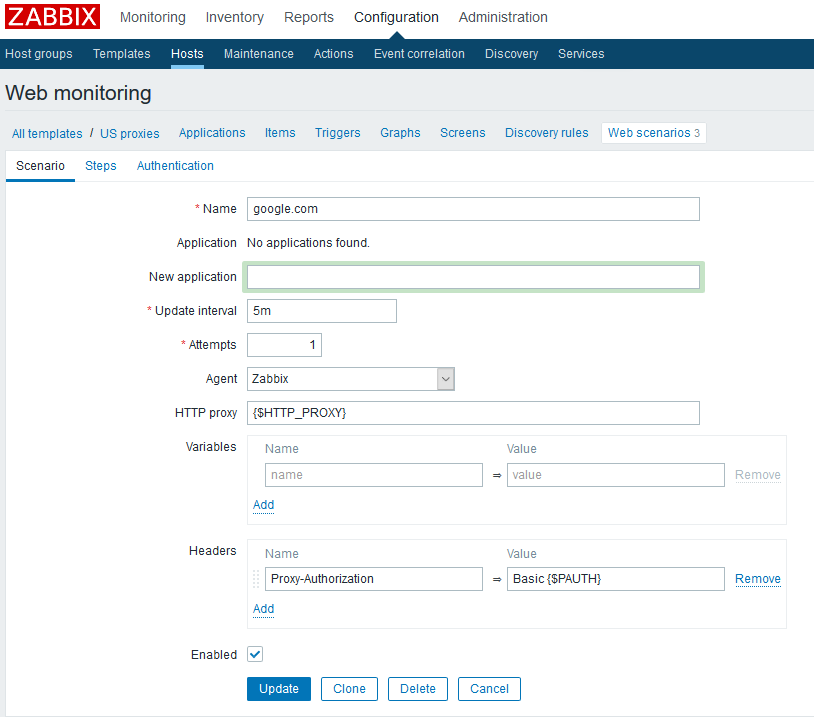
Answer: Yes, no problem. In really old versions this was not possible. See web scenario screenshot below.
Can the proxy be a variable so that the same web scenario can be used for different proxies?
Answer: Yes. Let’s say you attach a web scenario to a host. In that host’s configuration you can define a “macro” which sets the variable value. e.g., the value of HTTP_PROXY in my example. I think you can do the same from a template, but I’m getting ahead of myself.
Similarly, can you do basic proxy auth and hide the credentials in a MACRO? Answer: I think so. I did it once at any rate. See above screenshot.
Why does my google.com web scenario work whereas my amazon.com scenario not when they’re exactly the same except for the URL? Answer: some ideas, but the logging information is bad. Amazon does not take to bots hitting it for health check reasons. It may work better to change the agent type to Linux|Chrome, which is what I am trying now. Here’s my original answer: Even with command-line curl I get an error through this proxy. That can’t be good:
$ curl ‐vikL www.amazon.com
My amazon.com web scenario is not working (status of 1), yet in dashboard does not return any obvious warning or error or red color. Why? Answer: no idea. Maybe you have to define a trigger?
Say you’re on the Monitoring|latest data screen. Does the data get auto-updated? Answer: yes, it seems to refresh every 30 seconds.
In Zabbix Latest Data can you control the history displayed via url parameters? By default only one hour of history is displayed. Answer: There is an undocumented feature I have discovered which permits this. Let’s say your normal URL for your direct link to the latest data of item 1234 is https://drjohns.com/history.php?action=showgraph&itemids[]=1234. The modified version of that to display the last day of data is: https://drjohns.com/history.php?action=showgraph&from=now-1d&to=now&itemids[]=1234
In latest data viewing the graph for one item which has a trigger, sometimes the trigger line is displayed as a dashed line and sometimes not at all. Answer: From what I can tell the threshold line is only displayed if the threshold was entered as a number in the trigger condition. Strange. Unfortunate if true.
Why is the official FAQ so useless? Answer: no idea how a piece of software otherwise so feature-rich could have such a useless FAQ.
Zabbix costs nothing. Is it still actively supported? Answer: it seems very actively supported for some reason. Not sure what the revenue model is, however…
Can I force one or more web scenarios to be run immediately? I do this all the time in SiteScope. Answer: I guess not. There is no obvious way.
Suppose you have defined an item. what is the item key? Answer: You define it. Best to make it unique and use contiguous characters. I’m seeing it’s very important…
What is the equivalent to SiteScope’s script monitors? Answer: Either ssh check or external check.
How would you set up a simple PING monitor, i.e., to see if your host is up? Answer: Create an item as a “simple check”, e.g., with the name ping this host, and the key icmpping[{HOST.IP},3]. That can go into a template, by the way. If it succeeded it will return a 1.
I’ve made an error in my script for an external check. Why does Latest data show nothing at all? Answer: no idea. If the error is bad enough Zabbix will disable the item on you, so it’s not really running any longer. But even when it doesn’t do that, a lot of times I simply see no output whatsoever. Very frustrating.
Help! The Latest Data graph’s Y axis only shows 0’s and 5’s. Answer: Another wonderful Zabbix feature, this happens because your Units are too long. Even “per minute” as Units can get you into trouble if it is trying to draw a Y axis with values 22.0 22.5 23.0, etc: you’ll only see the .0’s and the .5’s. Change units to a maximum of seven characters such as “per min.”
Why is the output from an ssh check truncated, where does the rest go? Answer: no idea.
How do you increase the information contained in the zabbix server log? Let’s say your zabbix server is running normally. Then run this command: zabbix_server ‐R log_level_increase
You can run it multiple times to keep increasing the verbosity (log level), I think.
Attempting to use ssh items with key authentication fails with :”Public key authentication failed: Callback returned error” Initially I thought Zabbix was broken with regards to ssh public key authentication. I can get it to work with password. I can use my public/private key to authenticate by hand from command-line as root. Turns out running command such as sudo -u zabbix ssh … showed that my zabbix account did not have permissions to write to its home directory (which did not even exist). I guess this is a case of RTFM, because they do go over all those steps in the manual. I fixed up permissions and now it works for me, yeah.
Where should the scripts for external checks go? In my install it is /usr/lib/zabbix/externalscripts.
Why is the behaviour of triggers inconsistent. sometimes the same trigger has expected behaviour, sometimes not. Answer: No idea. Very frustrating. See more on that topic below.
How do you force a web scenario check when you are using templates? Answer: No idea.
Why do (resolved) Problems disappear no matter how you search for them if they are older than, say, 30 minutes? Answer: No idea. Just another stupid feature I guess.
Why does it say No media defined for user even though user has been set up with email as his media? Answer: no idea.
Why do too many errors disable an ssh check so that you get Status Disabled and have no graceful way to recover? Answer: no idea. It makes sense that Zabbix should not subject itself to too many consecutive errors. But once you’ve fixed the underlying problem the only recovery I can figure is to delete the item and recreate it. or delete the host and re-create it. Not cool.
I heard dependent items are the way to go to parse complex data coming out of a rich text item. How do you do that? Answer: Yes they are. I have gotten them to work and really give me the fine-grained control I’ve always wanted. I hope to show a real-life example soon. To get started creating a dependent item you can right-click on the dots of an item, or create a new item and choose type Dependent Item.
I am looking at Latest data and one item is grayed out and has no data. Why? Answer: almost no idea. This happens to me in a dependent item formed by a regular expression where the regular expression does not match the content. I am trying to make my RegEx more flexible to match both good and error conditions.
Why do my dependent items, when running a Check Now, say Cannot send request: wrong data type, yet they are producing data just fine when viewed through Latest data? Answer: this happens if you ran a Check Now on your template rather than when viewing an individual host. Make sure you select a host before you run Check Now. Actually, even still it does not work, so final answer: no idea.
Why do some regular expressions check out just fine on regex101.com yet produce a match for value of type “string”: pattern does not match error in Zabbix? Answer: Some idea. Fancy regular expressions do not seem to work for some reason.
Every time I add an item it takes the absolute maximum amount of time before I see data, whether or not I run check Now until I turn blue in the face. Why? Answer: no idea. Very frustrating.
If the Zabbix server is in one time zone and I am in another, can I have my view of timestamps customized to my time zone? Otherwise I see all times in the timezone of the Zabbix server. Answer: You are out of luck. The suggestion is to run two GUIs, one in your time zone. But there is a but. Support for this has been announced for v 5.20. Stay tuned…
My DNS queries using net.dns don’t do anything. Why? Answer: no idea. Maybe your host is not running an actual Zabbiox agent? That’ll do it. Forget that net.dns check if you can’t install an agent. Zabbix has no agentless DNS monitor for some strange reason.
A DNS query which returns many address records fails (such as querying an AD domain), though occasionally succeeds. Why?Answer: So your key looks something like this, right? net.dns.record[10.1.2.3,my-AD-domain.net,A,10,2,tcp]. And when you do the query through dig it works fine, right? E.g., dig +tcp my-AD-domain.net @10.1.2.3. And you’ve set the Zabbix response to type text? It seems to be just another Zabbix bug. You may have to use a script instead. Zabbix support has been able to reproduce this bug and they are working on it as we speak.
What does Check/Execute Now really do? Answer: essentially nothing as far as I tell. It certainly doesn’t “check now”, i.e., force the item to be run. However, if you have enough permissions, what you can do when you’re looking at an item for a specific Host is to run Test. Then Get Value. I usually get Permission Denied, however.
I want to show multiple things on a dashboard widget graph like an item plus its baseline (Ed: see references for calculating a baseline). What’s the best way? Answer: You can use the add new data set feature for instance to add your baseline. In your additional data set you put your baselines. Then I like to make the width 2, transparency 0 and fill 0. This will turn it into a thin bold line with a complementary color while not messing too much with the original colors of your items. The interface is squirrely, but, hey, it’s Zabbix, what did you expect?
I have a lot of hosts I want to add to a template. Does that Mass Update feature actually work? Answer: yes. Use it. It will save you time.
Help! I accidentally deleted an entire template. I meant to just delete one of its macros. Is there a revert? Answer: it doesn’t look like it. Hope you remember what you did…
It seems if I choose units in an item which have too many characters, e.g., client connections, the graph (in Latest Data) cuts it off and doesn’t even display the scale? Answer: seems so. It’s a bug. This won’t happen when using vector graphs in Dashboard. The graphs in Latest Data are PNG and limited to short Units, e.g., mbps. Changing to vector graphs has been in the roadmap but then disappeared.
Can I create a baseline? Nope. It’s on the roadmap. However, see this clever idea for building one on your own without too much effort.
I’ve put a few things on the same Dashboard graph. Why don’t they align? There are these big gaps. Zabbix runs the items when it feels like, and the result is gaps in data which Zabbix makes no attempt to conceal at the beginning and end of a graph. You can use Scheduling Intervals on your items to gain some control over this. See this article for details.
Besides cloning the whole thing, how can I change the name of a Dashboard? Answer: If you just click to edit a Dashboard the name appears fixed. However, click on the gear icon and that gives you the option to edit the dashboard name. It’s kind of an undocumented feature.
My SNMP MIB has bytes in/out for an interface when what I really want is bandwidth, i.e., Megabits per second. A little preprocessing on a 64-bit bytes value and you are there (32 bit values may roll over too frequently). See this article for details.
In functions like avg (sec|#num,<time_shift>), why is the time_shift argument so restricted? It can’t be a macro, contain a formula like 1w-30m, or anything semi-sophisticated. It just accepts a dumb literal like 5h? Answer: It’s just another shortcoming in Zabbix. How much did you pay for it? 🙂
I have an SNMP template with items for a hostgroup of dispersed servers. Some work fine. The one in Asia returns a few values, but not all. I am using Bulk Request.Answer (to your implied question!) You must have bad performance to that one. Use a Zabbix proxy with a longer timeout for SNMP requests. I was in that situation and that worked for me.
SNMPv3 situation. I have two identical virtual servers monitored by the same Zabbix proxy. Only one works. Command-line testing of snmpwalk looks fine. What could it be?’Answer: We are fighting this now. In our case the SNMP v3 engineIDs are identical on the two virtual servers because they were from the same image, whereas, if you read the specs, they are supposed to be unique, like a MAC address. Who knew? And, yes, once we made the engineIDs unique, they were fine in Zabbix.
Riddle: when is 80% not 80%? Answer: when pulling in used storage on a filesystem via SNMP and comparing it to storage size! I had carefully gotten a filesystem 83% full based on the output of df -m. But my trigger, set to go off at 80%, never went off. How could it be? The 83% includes some kind of reserved user space on the filesystem which is not included when you do the calculation directly. So I was at 78% or so in actuality. I changed the trigger to 75%.
My trigger for a DNS item, which relies on a simple diff(), goes off from time-to-time yet the response is the same. Why? Answer: We have seen this behavior for a CNAME DNS item. The response changed the case of the returned FQDN from time-to-time, and that is enough to set off the Zabbix diff()-based trigger! We pre-processed the output with a RegEx to just get the bits we wanted to examine to fix this.
Related question. My diff() trigger for a DNS item does NOT go off when the server actually goes down. What’s up with that? Answer: Although you might expect a suddenly unavailable server constitutes a “difference,” in Zabbix’s contorted view of reality it does not. I recommend an additional trigger using the function nodata().
Does the new feature of login using SAML actually work? Answer: Yes, we are using it in Zabbix v 5.0.
My OIDs for my filesystems keeps shifting around. What to do? Answer: Use low-level discovery. It’s yet another layer of abstraction and confusion, but it’s probably worth it. I intend to write up my approach in my practical Zabbix examples blog post.
After an Zabbix agent item goes bad (no data), Zabbix refuses to test it for a full 30 minutes after it went bad, despite an update interval of 5 minutes. Why? Answer: In one of the worst architectural decisions of all time, Zabbix created the concept of unsupported items. It works something like this: the very moment when you need to be told Hey there’s something wrong here is when Zabbix goes quiet. Your item became unsupported, which is like being in the penalty box for 30 minutes, during which time nothing works like you naively expected it to. Even the fact that your item becameunsupported is almost impossible to find out from a trigger. An example of software which treats this situation correctly is Microfocus SiteScope. In Zabbix in version 5.0 there’s a global timeout for all unsupported items. Ours is set to 30 minutes, you see. In some cases that may make sense and prevent Zabbix from consuming too many resources trying to measure things which don’t work. I find it annoying. For DNS, specifically, best to use a key of type net.dns and not net.dns.record. That returns a simple 0 or 1 and does not become unsupported if the dns server can’t be reached. V 5.2 will provide some more options around this issue. For a HTTP agent and I suppose many other items, it’s best to create triggers which use the nodata() function, which can somewhat compensate for this glaring weakness in Zabbix. If you run Zabbix v 5.2, you should use the new preprocessing rule “Check for not supported value” and then set new value e.g. “Error”. Then the Item won’t become unsupported and can also be used for triggers.
We’ve got SNMP items set up for a host. What’s the best way to alert for a total outage? Answer: I just learned this. This is closely related to the previous question. To avoid that whole unsupported item thing, you make a Zabbix internal item. the key is literally this: zabbix[host,snmp,available] and type is numeric unsigned. This wil continue to poll even if the other host items became unsupported. This is another poorly documented Zabbix feature.
While trying to set up a host for SNMP monitoring I get the error Cannot update Host. Cannot find host interface on host_name for item key item_name. Answer: You probably used an interface type of Agent instead of SNMP. Under Interfaces for the host, add one for type SNMP and remove the Agent one. Or, maybe the reverse: your item type is of type Zabbix agent but your host’s interface is of type SNMP – that combo also produces this error.
In Zabbix my SNMP item shows error No such instance currently exists at this OID, yet my snmpwalk for same shows it works. Why? Answer: In my case I switched to snmpget for my independent testing and reproduced that error, and found that I needed a literal .”0″ at the end of the OID (specifically for swap used on an F5 device). Once I included the .”0″ (with the double-quotes) in the OID in Zabbix it began to work. In another case I could do the snmpget from the same zabbix proxy where I was getting this error message. The custom MIB was right there in /usr/share/snmp/mibs on the Zabbix proxy. Zabbix hadn’t been started in awhile. I restarted it and the problem went away.
I wish to use a DNS value instead of an IP in net.tcp.service[service,IP,port] because I use geoDNS or round-robin DNS. Can I? Answer: It seems to work, yes.
Can I send alerts to MS teams? Answer: This is obviously a fake question. But the answer is Yes. You set up a Connector in a MS Teams channel. It’s pretty staight forward and it’s pretty cool. I’ll try to publish more in my Zabbix tips post if I have time.
Get a lot of false positives? Answer: Yes! On F5 equipment this one is vexing me:
Resolved: BIG-IP is unreachable via SNMP for 15 minutes
And for others (pool member unavailable for a few minutes) I tried to require two consecutive failures before sending an alert. Basically still working on it.
I have a bunch of HTTP items on this one Zabbix proxy. They all sort of go bad at the same time (false positives) and Zabbix says this agent is unreachable for five minutes around the same time. Answer: Seen that. Short term it may be advisable to create a dependent trigger: https://www.zabbix.com/documentation/5.0/manual/config/triggers/dependencies Mid-term I am going to ask support about this problem.
Why is the name field truncated in Monitoring | Latest Data, with no possibility to increase it? Answer: If you have Show Details selected you see very few characters. Deselect that.
What, Zabbix version 5.2 RPMs are not available for RHEL 7? Answer: that is correct, unfortunately, as of this writing. You can run as high as v 5.0.7. We are trying to pressure them to provide this compatibility. Lots of people still run Redhat v 7.
Can you send reminder alerts periodically for a problem which persists? Answer: Yes you can. For instance, every four hours. Read all about it in the manual, under Action | Escalations, and look at their examples. However, the documentation is at odds with the product’s behaviour if you have multiple alerts with different durations defined. I am studying it…
Is Zabbix affected by the same hack that infected SolarWinds? Answer: No idea. Let’s see. Developed in Eastern Europe. Basically, no one’s saying. Let’s hope not.
Is Zabbix stupid enough to send multiple alerts for the same problem? Answer: In a word, yes. If you are unlucky enough to have defined overlapping alert conditions in your various alerts, Zabbix will make no effort to consolidate them.
What does it mean when I look at a host and I see inaccessible template? Answer: Most likely explanation is that you don’t have permission to see that template.
Can the y-axis be drawn in a logarithmic scale in a dashboard graph? I have low values (time for a DNS query) which sometimes soar to high ones. Answer: No. This feature has been requested now for almost 10 years and still is lacking. I will try to make a feature request.
Why does our Zabbix agent time out so often? The message is Zabbix agent on hostname is unreachable for five minutes. The problem is sporadic but it really interferes with the items like our simple net.dns checks. Answer: If you use a lot of net.dns agent items you can actually cause this behavior if you are running agent2. The default agent item is passive. We had better luck using an Active Agent item. We had severe but random timeouts and they all went away.
Our Webhook to MS Teams was working fine. Then we set up a new one to a new channel which wouldn’t work at all. A brief error message says invalid Webhook or something. What’s the fix? Answer: It is a known bug which is fixed in v 5.0.8. Of course a lot else could be wrong. In fairness Microsoft changes the format for webhooks from time-to-time so that could be the problem. This Microsoft page is a great resource to do your own testing of the Webhook: Sending messages to Connectors and Webhooks – Teams | Microsoft Docs
The formatting of alert emails is screwy, especially with line breaks in the wrong places. Can I force it to send HTML email to gain more control? Answer: Sort of. You can define a media type where you use HTML email instead of plain text email. I personally don’t have access to do that. But it is not possible to selectively use HTML email within the Custom email form of the alert setup screen. With the more straightforward custom emails, the trick is to put in extra line breaks. A single solitary linebreak is sometimes ignored, especially if the sequence is MACRO-FUNCTION linebreak more text. But if you use two consecutive linebreaks it will inject two linebreaks.
I swear Zabbix is ignoring my macros in trigger functions used in templates which refer to time values in minutes, and just filling in 0 instead. Is that even possible? Answer: I’m still investigating this one. I will withold my customary sardonic comments about Zabbix until I know who or what is to blame. [Later] I’m thinking this one is on me, not Zabbix.
Do Zabbix items, particularly HTTP items, have the concept of a hidden field to hide confidential data such as passwords from others with the same level of access? Answer: Apparently not. But if you believe in the terrible idea of security by obscurity, you can obscure values by stuffing them into a macro.
My Zabbix admin won’t let me get creative. No external items, no ssh items, etc. I can run some interesting scripts on my linux server. How to stuff the results into Zabbix? Answer: Install zabbix_sender utility on your linux. Then set up an item of type Zabbix trapper. The link to the RPM for zabbix_sender is in the references.
These days nothing is either black or white. So when a trigger fires, it’s likely it will return to good status, and then bad, and then good, etc. The alerts are killing us and casual users tend to discount all of them. What to do? Answer: This is common-sense, but, a very good strategy in these cases is to define a recovery expression for that trigger that looks at the average value for the last 3600 seconds and requires it to be in the good range before the trigger that all is good gets sent out as an alert.
I’m using the dynamic host feature in a dashboard. Unfortunately, one of my hosts has a really short name that matches so many other hosts that it never appears in the drop-down list. What to do? Answer: Click the “select” button to the right of the search field. Then you can choose the host group and from there the host. Or rename the host to somethng more unique.
I wish to add some explanatory text in the dashboard I’ve created. Is it possible? Answer: This is laughably kludgy, but you can do this with a map widget. What you can do is to create a map, add a text box to it, and put your desired text into the text box. But it is hard to get the sizing correct as things shrink when putting the widget on the dashboard.
My top hosts widget is now displaying 0’s. Answer: This happened after we upgraded from v 6.0 to 6.0.8. In characteristically Zabbix illogical fashion, if you now sort by BottomN instead of TopN you should see the expected results (highest on top). Not all our widgets displayed this bug!
I have an item which only runs once a week. Monitoring > Latest Data doesn’t show any values. Is that a bug or feature? Answer: There is a setting somewhere where you can change this behavior. Set it to last two weeks and all will be well.
While using the pyzabbix Zabbix api I had trouble switching from username/password to use an authentication token. Answer: Perhaps yuo installed both py-zabbix as well as pyzabbix? I’m confused by this. as there is some overlap. To use the token auth method – preferred by experts – uninstall both these packages and re-install only pyzabbix. I will give an example in my other Zabbix blog post, Practical Zabbix examples.
The trigger.create api call says a dependent triggerid must be passed? Is that really mandatory? It makes no sense. Answer: No. I experimented with it and found you can just leave the dependencies out altogether. The documentation is wrong.
I need to create about 100 custom alerts. Is there seriously no way to do this via the api? Answer: apparently not.
What’s the correct way to send a compound filter expression via the api? Answer: Watch out! If you are trying to filter on suppressed problems, do not put a reference to suppressed in your filter. Instead it goes outside the filter like so: zapi.problem.get(…,suppressed=False,filter={‘name’:…})
Monitoring > Problems > History view is slow. Then it grays out periodically. Answer: Zabbix is spending all its time figuring out which host groups you have access to. To speed things up, explicitly enter only your accessible host groups in the filter.
geoMAP in Zabbix 6.0 is cool until you blow up a continent and see all the local geographical names written in their native language. So Asian placenames are inscrutable to Enlgih speakers. Is there any fix? Answer: You are probably using the provider, OpenStreetMap in this case, which is using localized names. You can switch providers (global setting).
I’m using a RegEx in the regsub function on an LLD macro. What flavor of RegEx are supported and what characters need to be escaped? Answer: Supposedly Perl-compatible (PCRE) RegExes are supported. For anything remotely complex, enclose your RegEx in double-quotes. Then, for good measure put a backslash (\) in front of any double-quote (“) you require as a match character, and a backslash in front of any slash (/) match character, plus the usual rules.
Why am I seeing the same host graph twice? Answer: This is a bug I have personally discovered in Zabbix 6.0. It occurs when you have a template with just a single item and a single graph. They will be working on it as of August 2022.
In latest data I see: Value of type “string” is not suitable for value type “numeric unsigned.” Why? Answer: I got this in Zabbix 6.4 when I used zabbix_sender with argument -o 36 which I thought would feed in the integer 36. But no, it got interpreted as a string. I tried to introduce a preprcoessing step but I could not get it to work. In the end I created a dependent item with a RegEx to convert it. I made the original item type character. I could not beat this in a simple way.
I can’t get my new agent to be seen by its Zabbix proxy. Error is failed to accept an incoming connection: from [agent]: reading first byte from connection failed: [104] Connection reset. Answer: You may be running a Palo Alto firewall perhaps? They will permit the tcp handshake and then drop the connection with a “reset both sides.” which produces this error. Thus super simplified connection tests you run by hand with nc/nmp may appear to work.
Does changing the name of a host change its hostid? Answer: No. We have a multi-stage discovery process which relies on this fact.
Does the hosts IP filter accept a subnet mask? Answer: No, it is very primitive. It does accept a partial IP, strangely enough, so 10.9.9 matches 10.9.9.0/24.
A word about SSH checks and triggers
Through the school of hard knocks I have learned that my ssh check is clipping the output from the executed command. So you know that partial data you see when you look at latest data, and thought it was truncating it for display purposes? Nuh, ah. That’s all you’re getting to go up against in your trigger, which sucks. It’s something like 260 characters. I got lucky in a sense to discover this early by running an ssh check against dns resolution of amazon.com. The response I got varied almost every 60 seconds depending on whether or not the response came out of the dns cache. So this was an excellent testbed to learn about the flakiness of triggers as well as waste an entire day.
Another thing about triggers with a regex. As far as I can tell the logic is reversed. So you think you’re defining the OK condition when you seek to match the output and have it given the value of 1. But instead try to match the desired output for the OK condition, but assign it a value of 0. I guess. Only that approach seems to work for me. And getting the regex to treat multiple lines as a unit was also a little tricky. I think by default it favored testing only against the last line.
So let’s say my output as scraped from Monitoring|Latest Data alternated between either
proxy1>test dns amazon.com
Performing DNS lookup for: amazon.com

DNS Response data:
Official Host Name: amazon.com
Resolved Addresses:
  205.251.242.103
  176.32.98.166
  176.32.103.205
Cache TTL: 1, cache HIT
DNS Resolver Response: Success
proxy1>test dns amazon.com
Performing DNS lookup for: amazon.com
DNS Response data:
Official Host Name: amazon.com
Resolved Addresses:
205.251.242.103
176.32.98.166
176.32.103.205
Cache TTL: 1, cache HIT
DNS Resolver Response: Success
or
proxy1>test dns amazon.com
Performing DNS lookup for: amazon.com

Sending A query for amazon.com to 192.168.135.145.

Sending A query for amazon.com to 8.8.8.8.

DNS Response data:
Official Host Name: amazon.com
Resolved Addresses:
  20
proxy1>test dns amazon.com
Performing DNS lookup for: amazon.com
Sending A query for amazon.com to 192.168.135.145.
Sending A query for amazon.com to 8.8.8.8.
DNS Response data:
Official Host Name: amazon.com
Resolved Addresses:
20
, then here is my iregexp expression which seems to do the correct thing (treat both of these outcomes as successes):
{proxy1:ssh.run[resolve DNS,1.2.3.4,22,utf-8].iregexp("(?s)((205\.251\.|176\.32\.)|Sending A query.+\s20)")}=0
{proxy1:ssh.run[resolve DNS,1.2.3.4,22,utf-8].iregexp("(?s)((205\.251\.|176\.32\.)|Sending A query.+\s20)")}=0
Note that the (?s) at the beginning helps, I think, to treat the newline character as just another character which matches “.”. I may have an extra set of parentheses around the outermost alternating expression, but I can only experiment so much…
I ran various tests such as to change just one of the numbers to make sure it triggered.
I now think I will get better, i.e., more complete, results if I make the item of type text rather than character, at least that switch definitely helped with another truncated output I was getting from another ssh check. So, yes, now I am capturing all the output. So, note to self, use type text unless you have really brief output from your ssh check.
So with all that gained knowledge, my simplified expression now reads like this:
{proxy:ssh.run[resolve a dns name,1.2.3.4,22,utf-8].iregexp("(205\.251\.|176\.32\.)")}=0
{proxy:ssh.run[resolve a dns name,1.2.3.4,22,utf-8].iregexp("(205\.251\.|176\.32\.)")}=0
Here’s a CPU trigger. From a show status it focuses on the line:
CPU utilization: 29%
and so if I want to trigger a problem for 95% or higher CPU, this expression works for me:
So I will accept the results as OK as long as at most one of five packets was dropped.
A lesson learned from SNMP monitoring of F5 devices
My F5 BigIP devices began producing problems as soon as we set up the SNMP monitoring. Something like this:
Node /Common/drj-10_1_2_3 is not available in some capacity: blue (4)
Node /Common/drj-10_1_2_3 is not available in some capacity: blue (4)
It never seemed to matter until now that my nodes appear blue. But perhaps SNMP is enforcing a best practice and expecting nodes to not be blue, meaning to be monitored. And it turns out you can set up a default monitor for your nodes (I use gateway_icmp). It’s found in Nodes | Default Monitor. I’m not sure why this is not better documented by F5. After this, many legacy nodes turn red so I am cleaning them up… But my conclusion is that I have learned something about my own systems from the act of implementing this monitoring, and that’s a good thing.
To be continued…
References and related
A good commercial solution for infrastructure monitoring: Microfocus SiteScope.
Just to put it out there: If you like Zabbix you may also like Specto. Specto is an open-source tool for monitoring web sites (“synthetic” monitoring). I know one major organization which uses it so it can’t be too bad. https://specto.sourceforge.net/
Since this document is such a mess I’m starting to document some of my interesting items and Practical Zabbix examples in this newer and cleaner post. It includes the baseline calculation formula.
Intro My jump server is getting old and they’re threatening to cut it off. A jump server is a server from which you launch CLI terminal sessions into your linux servers. Since my laptop has firewall access to all the same servers I wondered if I could build up a productive environment right within Windows 10 on my own laptop. For me this would be running GNU screen as a terminal multiplexer since I hop between terminal screens all day.
More details Windows 10 is coming around to more fully integrating with Linux! it’s about time. WSL, windows subsystem for Linux, is all about that. And things like bash shell, ubuntu and OpenUSE Linux are available from the windows store. But that was not an option for me. My organizaiton has shut all that down.
So I thought back to my days as a Cygwin user those many years ago… Could I get GNU screen running within Cygwin environment on Windows 10? Well, yes, I can with just a few tweaks.
I think the initial Cygwin install required admin privileges, but once installed to run it does not.
Within Cygwin screenis an optional package and you can run their setup program to search and install it.
Here is my .screenrc file
defscrollback 4000
#change init sequence to not switch width
termcapinfo  xterm Z0=\E[?3h:Z1=\E[?3l:is=\E[r\E[m\E[2J\E[H\E[?7h\E[?1;4;6l

# Make the output buffer large for (fast) xterms.
termcapinfo xterm* OL=10000

# tell screen that xterm can switch to dark background and has function
# keys.
termcapinfo xterm 'VR=\E[?5h:VN=\E[?5l'
termcapinfo xterm 'k1=\E[11~:k2=\E[12~:k3=\E[13~:k4=\E[14~'
termcapinfo xterm 'kh=\E[1~:kI=\E[2~:kD=\E[3~:kH=\E[4~:kP=\E[H:kN=\E[6~'

# special xterm hardstatus: use the window title.
termcapinfo xterm 'hs:ts=\E]2;:fs=\007:ds=\E]2;screen\007'

#terminfo xterm 'vb=\E[?5h
defscrollback 4000
#change init sequence to not switch width
termcapinfo xterm Z0=\E[?3h:Z1=\E[?3l:is=\E[r\E[m\E[2J\E[H\E[?7h\E[?1;4;6l
# Make the output buffer large for (fast) xterms.
termcapinfo xterm* OL=10000
# tell screen that xterm can switch to dark background and has function
# keys.
termcapinfo xterm 'VR=\E[?5h:VN=\E[?5l'
termcapinfo xterm 'k1=\E[11~:k2=\E[12~:k3=\E[13~:k4=\E[14~'
termcapinfo xterm 'kh=\E[1~:kI=\E[2~:kD=\E[3~:kH=\E[4~:kP=\E[H:kN=\E[6~'
# special xterm hardstatus: use the window title.
termcapinfo xterm 'hs:ts=\E]2;:fs=\007:ds=\E]2;screen\007'
#terminfo xterm 'vb=\E[?5h
lt;200/>\E[?5l' termcapinfo xterm 'vi=\E[?25l:ve=\E[34h\E[?25h:vs=\E[34l' # emulate part of the 'K' charset termcapinfo xterm 'XC=K%,%\E(B,[\304,\\\\\326,]\334,{\344,|\366,}\374,~\337' # xterm-52 tweaks: # - uses background color for delete operations termcapinfo xterm ut #from https://stackoverflow.com/questions/359109/using-the-scrollwheel-in-gnu-screen termcapinfo xterm* ti@:te@ escape ^\\ # changes espace sequence password
lt;200/>\E[?5l' termcapinfo xterm 'vi=\E[?25l:ve=\E[34h\E[?25h:vs=\E[34l' # emulate part of the 'K' charset termcapinfo xterm 'XC=K%,%\E(B,[\304,\\\\\326,]\334,{\344,|\366,}\374,~\337' # xterm-52 tweaks: # - uses background color for delete operations termcapinfo xterm ut #from https://stackoverflow.com/questions/359109/using-the-scrollwheel-in-gnu-screen termcapinfo xterm* ti@:te@ escape ^\\ # changes espace sequence password
Note that in my .screenrc I use <Ctrl-\> as my escape sequence, so, e.g., to pop to the previous screen it is <Ctrl-\> <Ctrl-\>. I’m not sure that’s standard but my fingers will remember that to my dying day. They probably still remember some of those EDT/TPU VAX editor commands to this day!
Compare and contrast Here are my day 0 observations.
ssh, curl, nslookup and tracert are coming from the underlying Windows system (do a which curl to see that) so that means you get the dumb version your system has.
So there is no dig, and no nc or netcat.
touch, cat, mkdir and vi behave pretty normally. man pages are installed, which can be a help.
If you use proxy, a funny thing can happen and your environment variables can get mixed. You may have inherited an HTTP_PROXY environment variable form the system, but the alias you copied from a linux jump server probably defines an http_proxy environment variable (lower case). And both can co-exist! As to which one curl would then use, who knows? Better just stick to working with the upper-case one and NOT define another in lower case.
For awhile it looked like scrolling was not working at all when screen was running. Then i found that tip I reference at the bottom of my .screenrc file which makes scrolling work via the mouse’s scroll wheel, which isn’t too bad.
Old friends like ls, grep, echo and while (built-in bash command) are available however. dig can be installed from the bind-utils package.
A lot of other packages are optionally available, including a whole X-Windows environment, which I used to run in the past but hope to avoid this time around.
No crontabs however (to have cron daemon requires installing admin privileges) which kind of hurts.
Simple output redirection seems to work, as does job control, e.g.,
ping -t 8.8.8.8 > /dev/null 2>&1 &
ping -t 8.8.8.8 > /dev/null 2>&1 &
Not sure why you’d want to run the above command, but this nice example shows that the /dev/null device exists, and the ping command is inherited from your Windows environment hence the -t option to run it indefinitely, and that it will create a background process which you can view and control with jobs / kill.
Now I typically move my laptop off the work environment each night, so all my ssh logins will be lost, unlike the jump server situation. But our jump server isn’t that stable anyway so no big loss I’d say…
I am sooo used to highlighting text in Teraterm, which is my current environment, and that being sufficient to put that text into the clipboard, that I keep doing that in this environment. But it doesn’t work. I have to use the CMD window convention of highlighting the text and then hitting ENTER to get it into the clipboard. oops. That was because I had been launching Cygwin from a CMD window. Now I am launching from a proper Cygwin shortcut and simple text highlighting works, BUT, right-clicking to paste it in brings up a menu rather than just doing it! So there’s that difference now… Instead of right-click I can quickly paste the text in doing a SHIFT-Insert.
ssh will get you
By default you end up using the Windows-10 supplied ssh, and that works pretty well. But when you’re ready to advance and need to put some thing into a .ssh/config file, forget about it. In principle it’s possible in Windows 10, but it’s too complex. Just install the ssh package. That in turn permits you the facility familiar to you where you can create a ~/.ssh/config file.
How to set your userid by default for your ssh logins
First make sure you install the Cygwin ssh package and are using that one. A which ssh should come back with /usr/bin/ssh.
My config file looks like this:
Host *
    User drjohn
That sets my default userid to be drjohn on any random server I ssh to.
New ssh error pops up
Unable to negotiate with 50.17.188.196 port 22: no matching key exchange method found. Their offer: diffie-hellman-group-exchange-sha1,diffie-hellman-group14-sha1,diffie-hellman-group1-sha1
This only happened when I switched from my Windows ssh to the Cygwin one. This is, of course, when connecting to a system (ironically, a firewall) with an old image. I think the only solution to be able to access these old systems is to switch back to the Windows 10 ssh – after all we never got rid of it and it used to work. Since all my customary ssh’s are aliased, this works well enough. I just made an alias like this
alias oldFW='screen -t oldFW /cygdrive/c/windows/system32/openssh/ssh.exe [email protected]'
since on my system the Windows 10 openssh is installed there in the system32 folder.
How do you get multiple login sessions (shells) within your screen to the localhost?
Well, you can’t just do a su – and you probably don’t have an ssh daemon running locally, so this is more of a non-trivial question than it first appears.
I define a bunch of aliases. My alias for getting an additional shell on the Windows 10 machine is this:
alias local=’screen -t localhost bash –login -i’
A word on package management I don’t know why I was afraid of installing packages when I first tried Cygwin over a decade ago. Now for me that’s the key – to understand and practice installing packages because it’s actually really easy when you’re used to it.
The key is to simply keep your initial install setup hanging around, setup-x86_64.exe. In my case it’s in my downloads directory. Example usage: I wondered if I could install a decent version of ping rather than continually suffer with the dumb DOS version. So, fire up the above-mentioned executable. Go through a few screens (where it remembers the answers from the initial install), then search for the package (Yes, it’s there!), and select to install the most recent version from the drop-down. A few more clicks and it’s done and available in your path. it’s that easy… Not sure about uninstalling because you almost never need to do that. It seems maybe a thousand packages are available? so no, there’s no yum or zypper or rpm or apt-get, but who really needs those anyway?
As a concrete example, I am learning about SNMP. So I got something running on a Bluecoat proxy, and I wanted to see what I could see. The guide recommended using snmpwalk, which of course I did not have. So I learned which package it is in with a DDG search, then ran the Cygwin setup, found that package, installed it, and voila, there was snmpwalk in my path. And it worked, by the way. Easy peasy. Creating your own scripts If you have the funny situation, like me, where you had enough privileges to install Cygwin, perhaps by temporarily assigning your account the Admin role, but when you use it day-to-day, you do not have admin privileges, you will find yourself unable to create files in some of the system directories like /usr/local/bin – permission denied! But in your home directory you will be able to edit files.
So what I did is to create a bin directory under my home directory, where I plan to add my home-grown scripts such as mimeencode, and make sure my PATH includes this directory with a statement like
export PATH=$PATH:${HOME}/bin
export PATH=$PATH:${HOME}/bin
which I put in my .alias file, which in turn I source from .bashrc.
2021 update: The fate of the screen package
I read somewhere the screen utility which I love is beyond repair and will have to be replaced by something else. Too bad. I’ve used it for about 10 years now.
X Windows
In a previous iteration of Cygwin I had installed the X Server components though I left it out this time around. For an X Server running on my PC, which I do need from time-to-time, I use MobaXterm. Seems to work OK for my purposes, which are very minimal. But I prefer to use Cygwin over MobaXterm for the command line stuff I do.
Conclusion GNU screen for Windows is indeed possible, but you gotta run it on top of Cygwin. It’s of interest that after all these years Cygwin is still viable on Windows 10. Cygwin can be run in a pretty lightweight fashion if you avoid the X-Windows stuff. There are some quirks but it is surprisingly linux-like at the end of the day. I believe it is really suitable as a replacement for a linux jump server. screen, for the uninitiated, is a temrinal multiplexer, which means it makes it very fast for you to switch between multiple terminal windows.
Some things are a bit different.
I think I will use this both at work and at home… Nope! My home PC runs too darn slow to ever use the Cygwin environment. My work laptop has SSD which probably helps keep performance good.
It is possible to set up an ssh default user.
It is possible to create multiple local shells within one screen within one Cygwin terminal.
So it is really possible to have your Linux command line. I use it every day…
2022 update
WSL2 is the way to go now. The setup can be little tricky, however, but it is worth it. You get a full hypervisor environment, not an emulator as you have with Cygwin. I write it up here. References and related
If you have a linux jump server that runs screen, or just want to ssh to a linux server, teraterm can be a good choice (as opposed to putty or built-in ssh). These days it can be found here: https://osdn.net/projects/ttssh2/releases/
To have an X Server running locally, MobaXterm seems a good choice. It looks like it’s free: https://mobaxterm.mobatek.net/
Intro
I am just beginning to use Microsoft’s Azure cloud environment. Although I am inclined to be a fan of AWS, I haven’t looked at AWS networking for awhile, and the last time I did something I felt totally lost in trying to understand their terminology.
But in spite of my natural inclination to support everything Amazon, I gotta admit that Azure was a good, usable environment for what I needed to do; swap the public IPs on two VMs.
The details
I was not getting any help whatsoever from with my organization. But I did at least get sufficient access to the Resource Group where my Redhat 7.4 VM was running. That was a godsend.
In Azure network interfaces are resources. They have IPs like 10.0.1.4, 10.0.1.7, etc.
Public IP addresses are resources. They have IPs apprporiate for your region. They are typically associated with a network interface.
A network interface in turn is associated to a VM, typically.
For some reason which no one could explain to me, I could no longer patch my RHEL 7.4 server. That began about September 2019. Meantime, I was using an application which relied on a built-in package. Now Redhat always ships with old versions of everything, so running this old version plus lack of patches really put pressure on me to upgrade to a new OS. Can you do an in-place upgrade? As far as I can tell, no. I went with SLES 15 SP1 on a new VM within the same resource group and data center since I have some familiarity with Suse Linux. That OS had a newer version of that open source package, plus it could be patched.
But the IP of the old server was embedded in several places and switching it was not an option. What to do? What to do? Can you even swap IPs on two VMs within the same Resource Group? Who knows?
Well, it turns out you can. The documentation on the topic is pretty good and cleared up some things for me. Particularly the first two links in the references at the bottom.
I took this approach.
Changed the IP from dynamic to Static (go to configure section when looking at this resource). This should have been done from the get-go, but wasn’t. Who knew?
Dissociate the IP from the network interface.
Changed the second IP from dynamic to static.
Dissociate this IP from its network interface.
Associate IP to network interface of the SLES 15 server.
Associate second IP to network interface of the RHEL server.
And that’s it…. It worked like a charm.
Then I cleaned up some old public IP addresses which weren’t being used. You have to remember there is a shortage of IPs. So a lot of the quirk you encounter are due to their utilizing Ips as sparingly as possible. makes sense to me. For instance you can have a “public IP” resource which has no value! it may not get a value until its absolutely needed by virtue of being associated with a network interface on an active server. Stuff like that…
Conclusion
Yes, you can indeed swap public IPs on two servers if they belong to the same Resource Group and I guess the same data center. I know because I did it. As a bonus I found that the Azure documentation is pretty clear and sufficiently detailed.