I began to implement the autmoation of speedtest checks. I was running the jobs every 10 minutes, but we noticed something flaky in the results. On the hour and on the half hour the tests seemed to be garbage. What’s going on?
Our findings
Well, if you use a scheduler to run a speedtest every 10 minutes, it will start exactly on the hour and exactly on the half-hour, amongst other start times. We were running it eight times to test eight different paths. Only the last two were returning reliable results. The early ones were throwing errors. So I introduced an offset to run the jobs at 2,12,22,32,42,52 minutes. And with this offset, the results became much more reliable.
The inevitable conclusion is that too many other people are running tests exactly on the hour and half hour. A single run takes roughly 30 seconds to complete. And it must be that the servers which speedtest rely on are simply overwhelmed and refuse to do more tests.
I don’t think we ask a lot of our switches. A packet comes in on this port and goes out on this other port. That sort of thing. But, apparently, when the switch is a Cisco Nexus, that is asking too much. Maybe it will go to that other port. Let’s see, it depends who sent it. So then again, maybe not. So maybe device A can ping device B. Device B cannot ping device A. But it can ping device C and device C can ping A. Or maybe Jack can ping device 1 but not device 2 on the same subnet. Yet Jill can ping device 2 but not device 1!
Yes. Those are not theoretical examples, but, sadly, actual examples lifted from recent massive debugging sessions I’ve participated in, which, eventually, focused on the Nexus switch not treating all traffic as it should. Another example: larger packets were not getting through on the same vlan.
Sometimes the Cisco support engineer is too clever by half. We had one find a few errors on supervisor board 5 so we switched to board 6. That did nothing. We finally noticed that all problems were related to FEXes connected to slot 8. As a test we plugged a FEX into a different slot and, voila, things began to work better. But the Cisco guy did not see any errors on slot 8.
Well, you only get the same Cisco engineer for a limited time. Then their shift turns over and you get to explain the whole problem all over again to the next one. Yeah, supposedly they’re briefed, but ni reality not so much. So finally the second engineer was a little more pragmatic than the first too-clever guy. This is a quote from her: “I do not see errors on that module, but logically, it has to be the problem.” This of course is after we presented all the evidence to her. So we ordered an RMA, replaced that board and yes everything began to work.
I’ve been involved in two such massive debugging session over the last four months. No one from the Cisco side is saying it, but I will. These Nexus switches define flows behind the scenes. They can probably do some very clever things with these flows. But it is no longer a simple switch. And, sadly, when the flows don’t all work, no one at Cisco is prepared to look for that issue or even consider it as a possibility. They look for obscure errors. And, heaven forbid, they are, I guess, incapable of proving to themselves their switch as at fault – eating packets – by doing what any first semester network class would have, namely, mirroring some of the ports and examining the traffic for themselves. It is instead up to the customer to prove the switch is at fault.
So in my first debugging session, which lasted about 16 hours, Cisco did not really find the errors that would lead them to believe slot 8 was a problem. Yet its replacement fixed everything. In fairness, in the second debugging session, which only lasted five hours or so, they did see errors which justified a replacement. But at no time did they ever use the word flow or offer in detail how the errors they saw could have produced the weird results we were seeing (that was the Jack and Jill example from above).
Conclusion
We guys who run servers would like to think a switch is a switch is a switch. But Cisco is requiring us to up our game, even if they don’t up theirs. Their Nexus switches absolutely can eat some of your network traffic while passing other over the same ports. I’d like to call that flows, even if they refuse to use that term.
Answer: the one where their switch eats the DHCPDISCOVER packets. And the amazing thing is they never learn. And the second amazing thing is that they actually don’t apply the most basic networking debugging techniques when such a problem occurs. I’m talking your basic, DHCPDISCOVER packet goes to your switch, same DHCPDISCOVER packet never arrives to the DHCP server on same switch. We know it to be the case, but, to help convince yourself that your switch is eating the packets, do networky things like create a span port of the DHCP server’s port to prove to yourself that no DHCP requests are coming in. And yet, they are never prepared to do that, to propose that. So instead indirect proxies are used to draw the conclusion.
I’ve been involved in three of four such debugging sessions. They take hours. I took notes when it happened again this weekend. I guess that setup is pretty typical of how it plays out. A data center was moved, including a DHCP server. The new data center has a MAN network to the old one. All IPs were preserved. When they turned on the moved DHCP server DHCP lease were no longer getting handed out. In fact it was worse than that. With the moved DHCP sever turned off, most DHCP leases were working. But with it on, that’s when things really began to go south!
Here’s the switch port they noted for the iDRAC:
sh run int gi1/0/24
Building configuration…
Current configuration : 233 bytes
!
interface GigabitEthernet1/0/24
description --- To-cnshis01-iDRAC - iDRAC
switchport access vlan 202
switchport mode access
logging event link-status
speed 100
duplex full
spanning-tree portfast
ip dhcp snooping trust
end
The first line of course if the IOS command. OK, so they had that on the iDRAC, right. But on the actual server port they had this:
sh run int gi1/0/23
Building configuration…
Current configuration : 258 bytes
!
interface GigabitEthernet1/0/23
description --- To-cnshis01-Gb1 - Gb1
switchport access vlan 202
switchport mode access
logging event link-status
spanning-tree portfast
service-policy input PMAP_COS_REMARK_IN
service-policy output PMAP_COS_OUT
end
I basically told them cheekily up front that this is usually a network switch problem and that they have to play with the DHCP snooping enable setting.
And I have to say that the usual hours of debugging were short-circuited this time as they seemed to believe me, and simply experimented by adding
ip dhcp snooping trust
to the DHCP server’s main port. We immediately began seeing DHCPDISCOVER pakcets come in to the DHCP server, and the team testified that people were getting leases.
Final mystery explained
Now why were things behaving really badly – no leases – when the DHCP server was up but no DHCPDISCOVER requests were getting to it? I have the explanation for that as well. You see there is a standby DHCP server which is designed for failure of the primary DHCP server. But not for this type of failure! That’s right. There is an out-of-band (by that I mean not carried over DHCP ports like UDP port 67) communication between standby and primary which tells the standby Hey, although you got this DHCPDISCOVER request, ignore it becasue the primary is active and will serve it! And meanwhile, as we have said, the primary wasn’t getting the requests at all. Upshot: no one gets leases.
Just to mention it
My second-to-last debugging session of this sort was a little different. There they mentioned that there was a “global setting” which governed this DHCP snooping on the switch. So they had to do something with that (enable or disable or something). So there was no issue with the individual switch ports. For me that’s just a variation on the same theme.
2023 debugging session
Well, nothing has really changed two years after I originslly posted this article and I get on these troubleshooting sessions with the vendor, people from the firewall team, vendor management people – it’s quite an affair. And as before it always takes a minimum of a couple hours for the network vendor to find their mistakes in their configuration. I have just done two of these sessions in the last week.
The last one was a tad different. There was a firewalled segment. The PCs behind it were not receiving IPs from the dhcp server. It is worth mentioning. Someone suggested a traceroute from the dhcp server to this subnet. And then a traceroute to another subnet (non-firewalled) at the same site which was working. They looked completely different after the first few hops! So about an hour after that they found that they had forgotten to add a route for this subnet pointing to the firewall. And that makes sense in that on the dhcp server – unlike in most cases – I was see the DHCP DISCOVER and it was replying with a DHCP OFFER. But that DHCP OFFER was simply not getting to the firewall at the site.
Cute Mnemonic to remember the four DHCP phases
Can you never remember the phases of the DHCP protocol like me? Then remember only this: DORA.
Discover
Offer
Request
Ack
What’s the idea behind this feature?
Having done a total of zero minutes of research on the topic, I will anyway weigh in with my opinion! Suppose someone comes along and plugs in a consumer grade home router into your network. It’s probably going to act as a rogue DHCP server. Imagine the fun trying to debug that situation? We’ve all been there… These rogue devices are probably fairly common. So if your corporate switch doesn’t suppress certain DHCP packets from ports where they are not expected, then this rogue device will begin to take down your subnet and totally bewilder everyone. I imagine this setting that is the topic of this blog post stems from trying to suppress all unknown DHCP packets in advance. Its just that sometimes the setting is taken too far and, e.g., a firewall which relays DHCP requests is also getting its DHCP packets suppressed.
Conclusion
I normally would have presented this as part of my IT Detective series. But I feel this is more like a lament about the sad state of affairs with our network providers. And though I’ve seen this issue about four times in the past 12 months, they always act like they have no idea what we’re talking about. They’ve never encountered this problem. They have no idea how to fix it. And they have no idea how to further debug it.. What steps does the customer wish?
We woke up yesterday to no Internet. The usual remedies consumers go through did nothing to resolve the issue. What to do?
The details – November 25, 2020
The usual restarts or my router and the cable modem did not work. I plugged in my work laptop directly to the cable modem for some quick tests but that did not work.
I plugged my work-issued VPN router directly to the cable modem and it did not pick up an IP and re-establish the tunnel.
When I logged into my router I saw that its WAN IP was listed as 0.0.0.0, which means none at all.
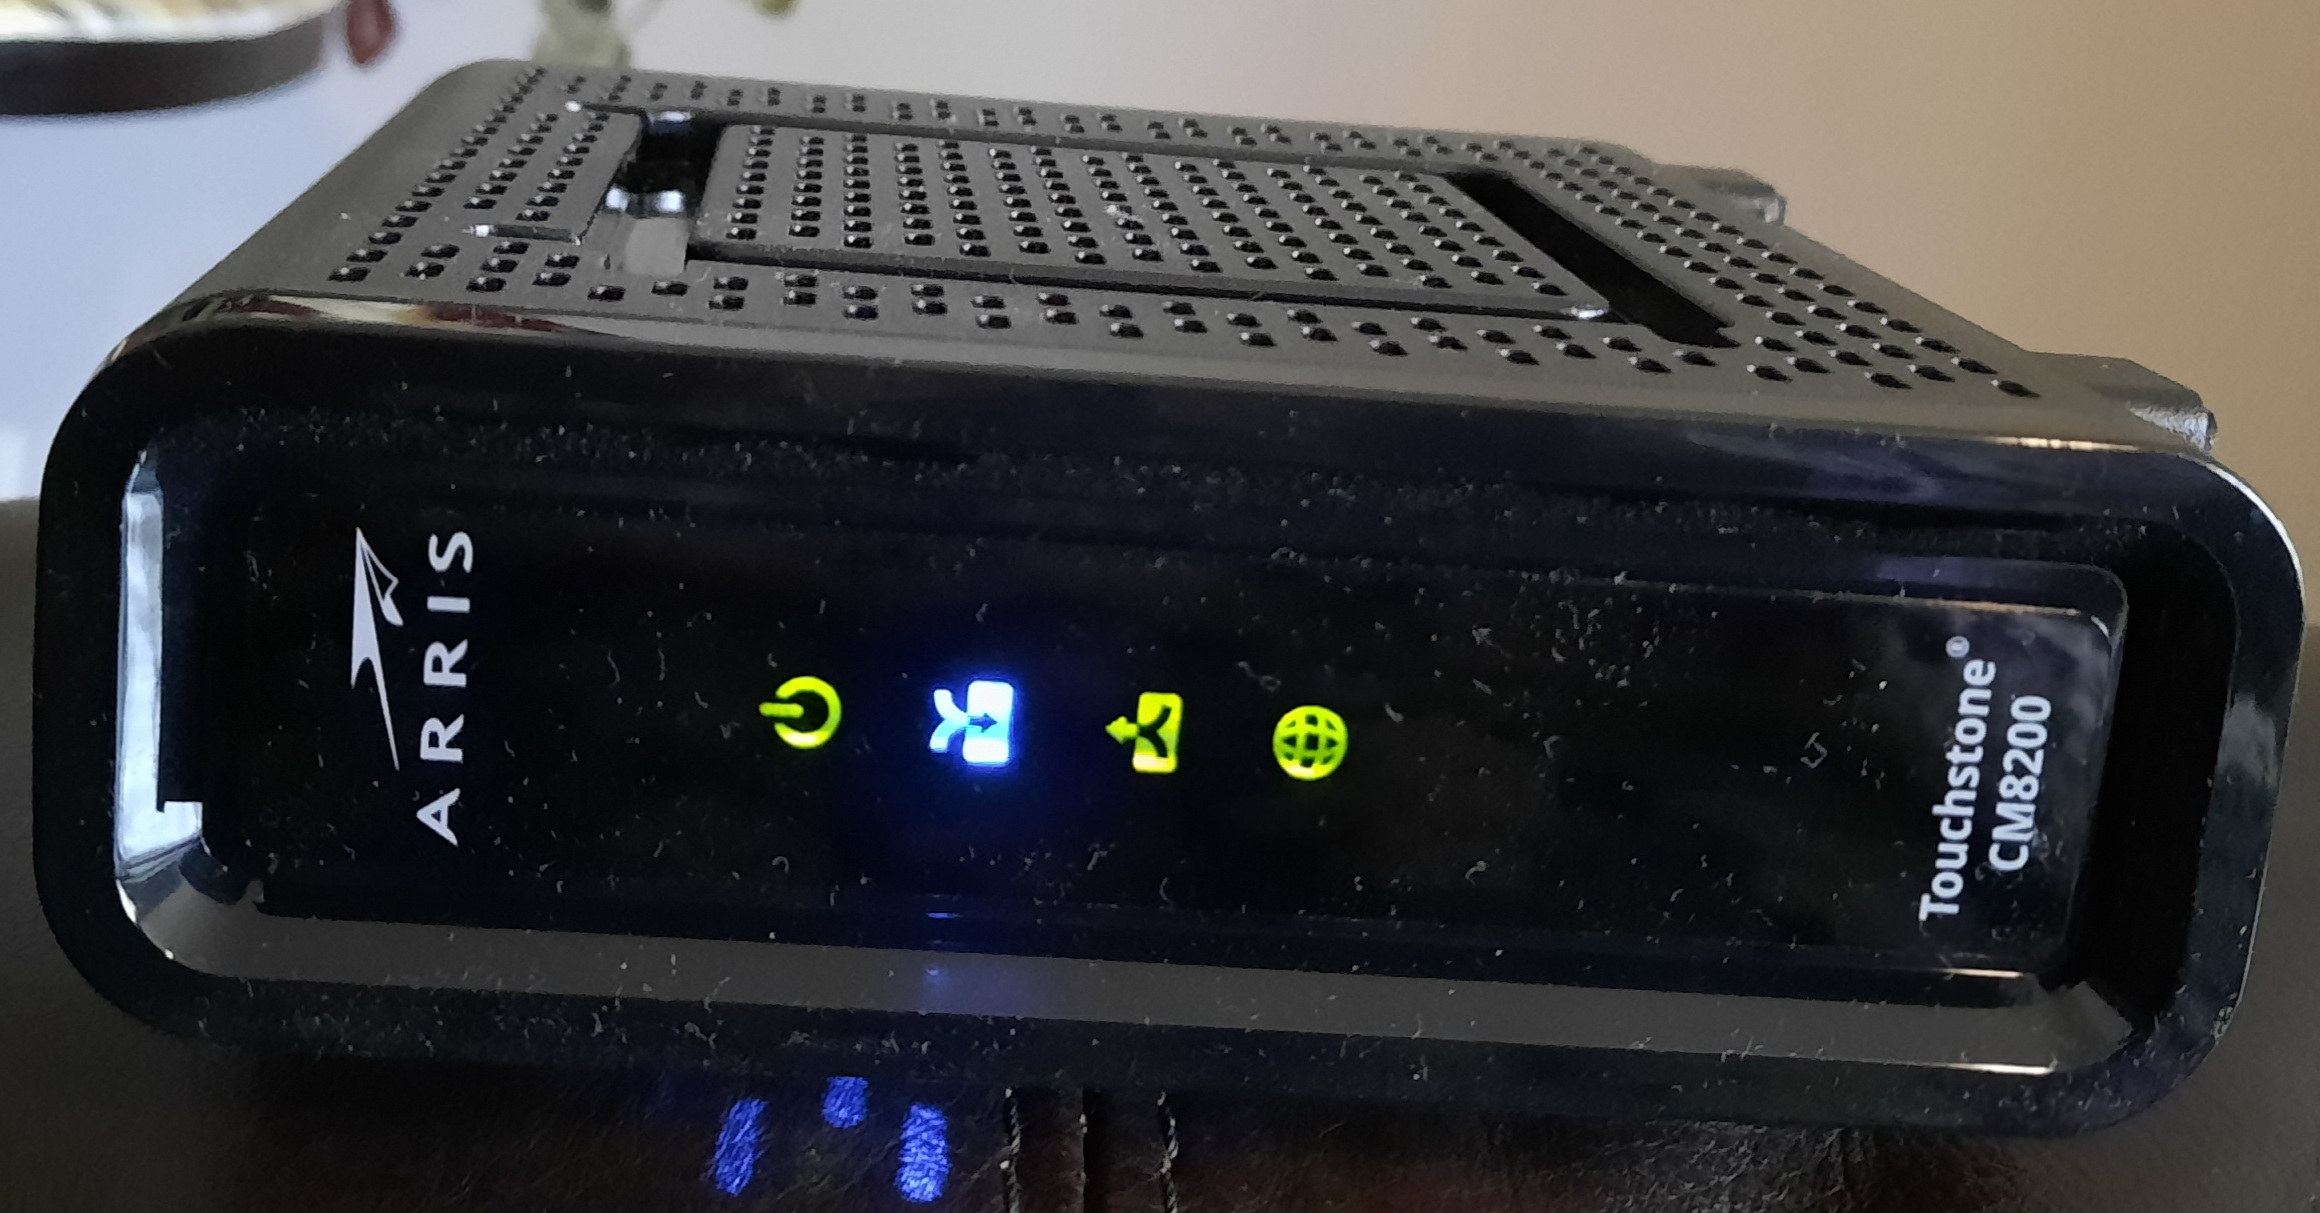
I called the ISP twice. Both time they said they could “see” my modem, and they tried to restart it on their end, but that did not seem to do anything at all, based on the constant status LEDs (see picture below). I got my service visit moved up from Dec 11th to Dec 2nd, but still that would mean a week without Internet – not so great when three people are relying on it for their work.
I rebooted the cable modem a couple times at least. Nothing changed.
Then I started some research on quickie alternatives. Ask a friend from work for a spare Cradlepoint air card? They’re already out on vacation. Get a Chinese-made unlocked hotspot with pre-purchased data? Seems fishy, and ultimately expensive. Verizon brand hotspot? We had a borrowed one. Very finicky. And no ethernet ports.
Raspberry Pi + DIY approach?
At one point in the evening, convinced I would have to wait days for for a visit from the cable guy, I rigged up a spare Raspberry Pi to act as a router between a mobile hotspot (a companion tablet to a Verizon phone) and my Linksys router. Why bother? Why not just use the hotspot directly? Mostly because it’s a pain in the rear to reprogram all those Internet of Things devices one has in ones home these days, notably the several Echo Dots, but as well, a wireless printer, a few laptops, Firesticks, tablets, etc. With this approach I keep the WiFi SSID as it was for all those devices. And, it sort of worked! At least I got one Echo Dot to work. I didn’t push my luck. This stuff consumes a lot of data, even when “idle.”
To be continued…
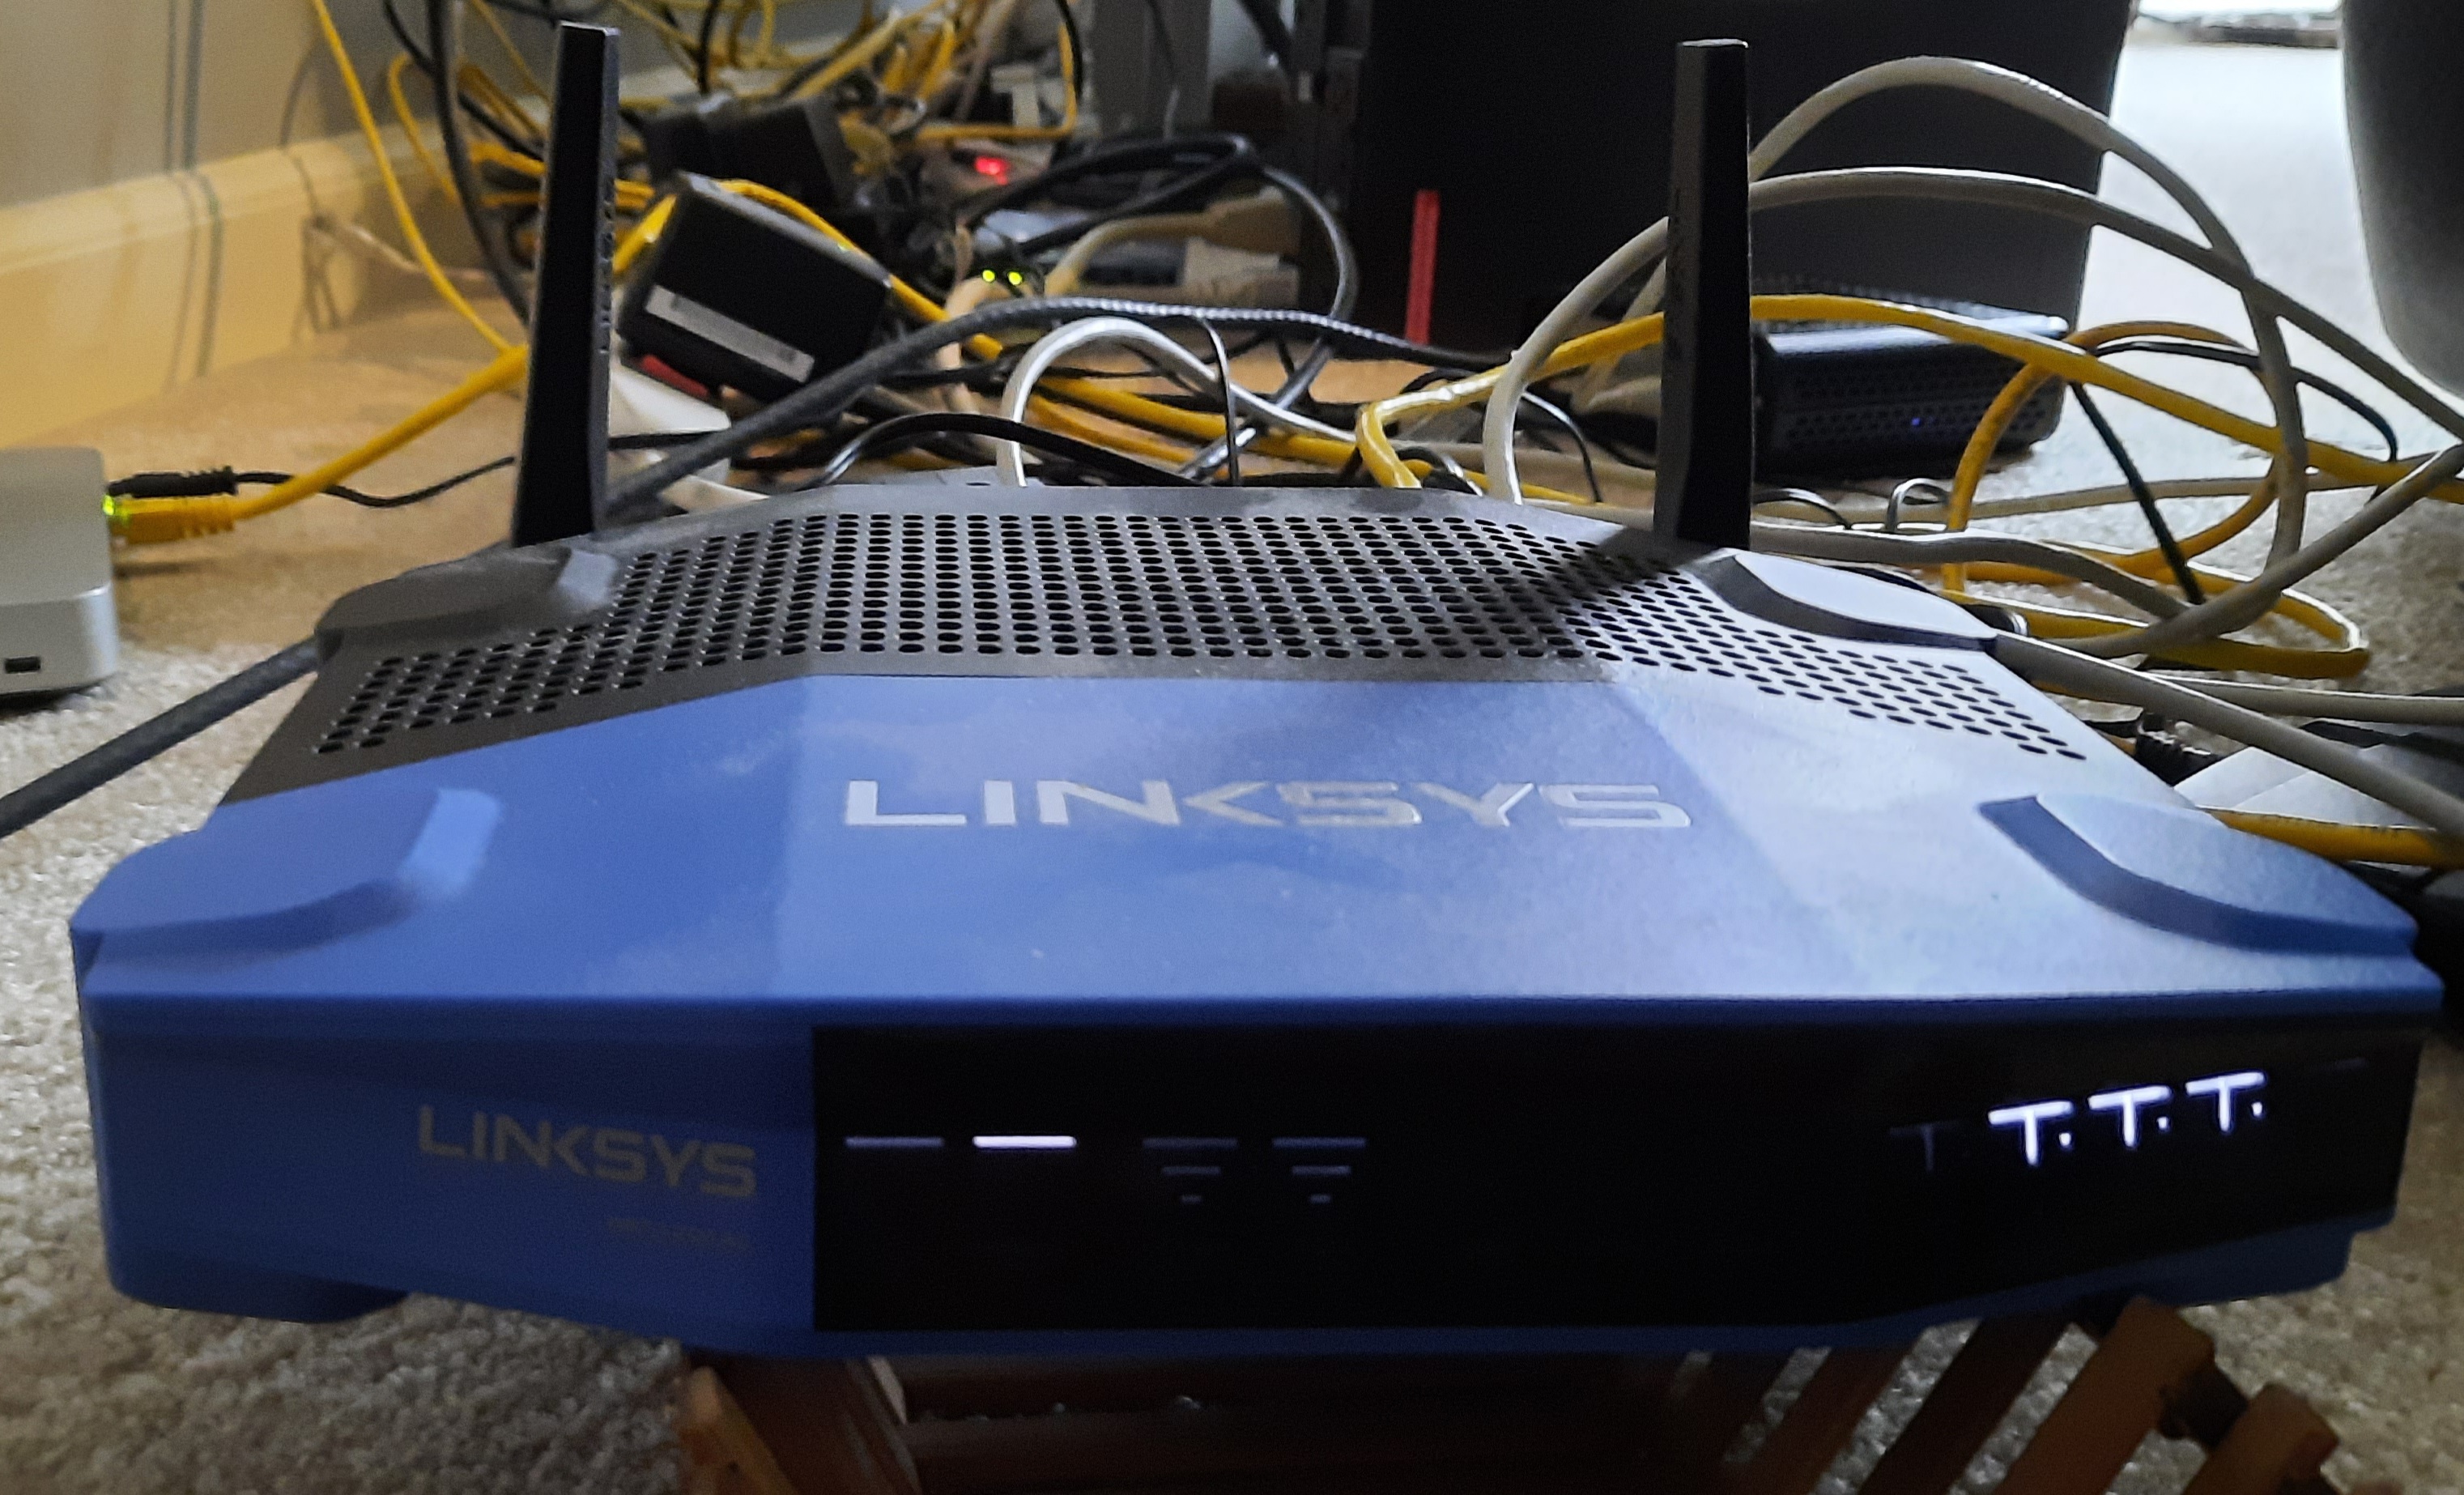
Linksys WRT1200AC status lights – when healthy!Cable Modem tatus lights – when operating normally
But I am pretty good at troubleshooting. What I know that less experienced people may not is that all the testing I’ve done to that point was not ironclad proof of failure of the cable modem. I know the traditional advice of old is to hook up a laptop directly to the ethernet port and work with it that way. Furthermore the cable company support said that my status lights were reading normally. So, when I tested my work laptop? Are you kidding? That thing has so many problems when I switch between SSIDs due to some new security software – it loves to display the Globe in the system tray, and the only recourse is to reboot. That’s what I was seeing, but notice I said a quickie test? I did not have time to do that reboot and all that. And that work-issued VPN router? I don’t know how that thing really works either. Never having set it up that way I did not trust reading too much into its results (which was essentially an orange status light instead of the usual white).
So when I had more time in the evening, I hooked up a home laptop which I know should work. After a cable modem reboot in fact I did get an IP and could surf the Internet. That was a glimmer of hope. So I put my router back in place. Still it did not pick up an WAN IP address. Still reading 0.0.0.0 for its IP.
Then I put the laptop back, writing down the IP, subnet mask and default gateway. Then I put my router back, switched its WAN mode from DHCP to fixed IP, putting on the exact IP address the laptop had picked up, with correct subnet mask and default gateway. Still it was not working. When the router is not working the WAN status light is sort of orange-ish. It’s white (pictured above) when the WAN link is communicating.
I decided the fault should lie more with my router than anywhere else, and since it wasn’t working and no number of power cycles was changing that situation, I decided that a factory reset is the thing to try. The last thing I could try. I noted the exact name and passwords of my SSIDs, held the reset button for 15 seconds until the status lights flicked out, and let it start up. It went through a start-up process, which i saw after connecting to its default IP of 192.168.1.1. It was clear it was not seeing the cable modem at the point where it should, but it had some very specific advice to try: power off cable modem, wait two minutes, power it back on, and then it would try again. And that did work! Yeah!
What may have precipitated this
My local cable company was recently bought by a much bigger company. I know for a fact what my WAN IP used to be, and I see it has changed. They now draw from a giant pool of IPs – a /14 in CIDR notation – that’s 262,000 addresses – that belongs to the new owner. So I believe the problem occurred due to a poor implementation of the dhcp protocol within my router, or a poor interplay between my router’s DHCP client and the ISP’s DHCP server. But I can’t research that line of troubleshooting because the ISP’s DHCP policies would require a lot of time-consuming experimentation on my part to reverse engineer based on observed behaviour under different conditions. And I would need an open source DHCP client – but I have the Raspberry Pi running dnsmasq for that, so that end could gather all the needed client information.
Prior to this acquisition I would tend to keep the same WAN IP for years – that’s how stable it was.
Another approach
Very germane to this topic is the fact that my neighbor down the street experienced his own Internet outage the day after I did! His solution was to buy a better cable modem. I did not know you could do that – I thought they were proprietary. He also saw his router with the 0.0.0.0 WAN address. And his approach also worked. This makes me less sure my router was really at fault – maybe Altice screwed up their DHCP service for half a day.
Conclusion
Unusual for me, I’m going to write the conclusion before writing the tedious part which is the full explanation in the middle.
By the end of the day I got the Internet working. After isolating the problem to my home router, the Linksys WRT1200AC, and determining that any amount of power cycling was not clearing things up, a factory reset did the trick! The cable modem and my cable Internet service was fine all along.
Intro
You have to dig a little to find out about this somewhat obscure topic. You want to send syslog output, e.g., from the named daemon, to a syslog server with beefed up security, such that it requires the use of TLS so traffic is encrypted. This is how I did that.
The details
This is what worked for me:
...
# DrJ fixes - log local0 to DrJ's dmz syslog server - DrJ 5/6/20
# use local0 for named's query log, but also log locally
# see https://www.linuxquestions.org/questions/linux-server-73/bind-queries-log-to-remote-syslog-server-4175
669371/
# @@ means use TCP
$DefaultNetstreamDriver gtls
$DefaultNetstreamDriverCAFile /etc/ssl/certs/GlobalSign_Root_CA_-_R3.pem
$ActionSendStreamDriver gtls
$ActionSendStreamDriverMode 1
$ActionSendStreamDriverAuthMode anon

local0.*                                @@(o)14.17.85.10:6514
#local0.*                               /var/lib/named/query.log
local1.*                                -/var/log/localmessages
#local0.*;local1.*                      -/var/log/localmessages
local2.*;local3.*                       -/var/log/localmessages
local4.*;local5.*                       -/var/log/localmessages
local6.*;local7.*                       -/var/log/localmessages
...
# DrJ fixes - log local0 to DrJ's dmz syslog server - DrJ 5/6/20
# use local0 for named's query log, but also log locally
# see https://www.linuxquestions.org/questions/linux-server-73/bind-queries-log-to-remote-syslog-server-4175
669371/
# @@ means use TCP
$DefaultNetstreamDriver gtls
$DefaultNetstreamDriverCAFile /etc/ssl/certs/GlobalSign_Root_CA_-_R3.pem
$ActionSendStreamDriver gtls
$ActionSendStreamDriverMode 1
$ActionSendStreamDriverAuthMode anon
local0.* @@(o)14.17.85.10:6514
#local0.* /var/lib/named/query.log
local1.* -/var/log/localmessages
#local0.*;local1.* -/var/log/localmessages
local2.*;local3.* -/var/log/localmessages
local4.*;local5.* -/var/log/localmessages
local6.*;local7.* -/var/log/localmessages
The above is the important part of my /etc/rsyslog.conf file. The SIEM server is running at IP address 14.17.85.10 on TCP port 6514. It is using a certificate issued by Globalsign. An openssl call confirms this (see references).
Other gothcas
I am running on a SLES 15 server. Although it had rsyslog installed, it did not support tls initially. I was getting a dlopen error. So I figured out I needed to install this module:
Intro
I share some Zabbix items I’ve had to create which I find useful.
Low-level discovery to discover IPSEC tunnels on an F5 BigIP
IPSec tunnels are weird insofar as there is one IKE SA but potentially lots of SAs – two for each traffic selector. So if your traffic selector is called proxy-01, some OIDs you’ll see in your SNMP walk will be like …proxy-01.58769, …proxy-01.58770. So to review, do an snmpwalk on the F5 itself. That command is something like
snmpwalk -v3 -l authPriv -u proxyUser -a SHA -A shaAUTHpwd -x AES -X AESpwd -c public 127.0.0.1 SNMPv2-SMI::enterprises >/tmp/snmpwalk-ent
Now…how to translate this LLD? In my case I have a template since there are several F5s which need this. The template already has discovery rules for Pool discovery, Virtual server discovery, etc. So first thing we do is add a Tunnel discovery rule.
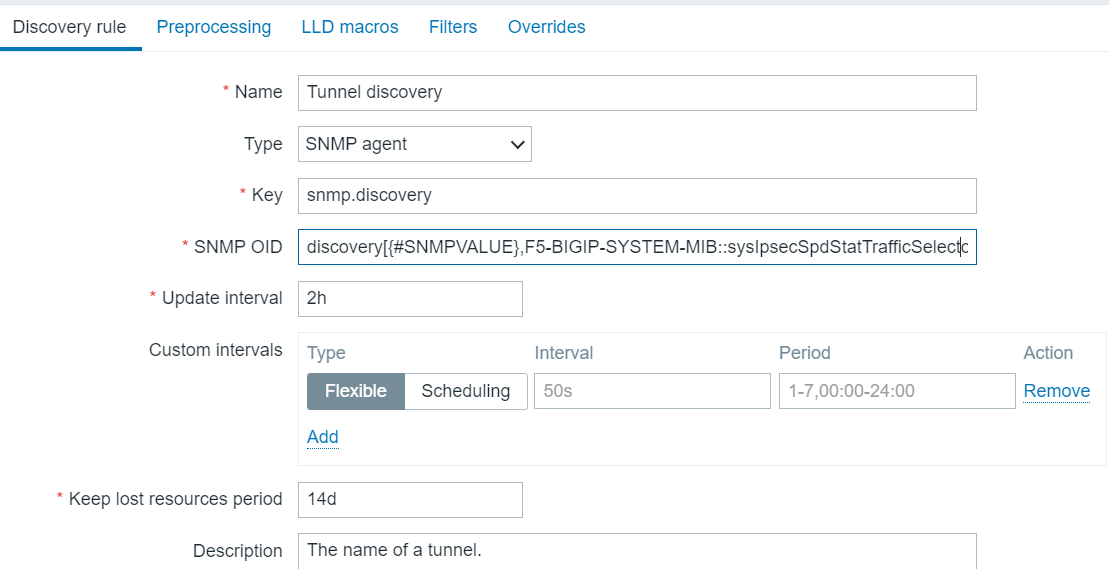
Tunnel Discovery Rule
The SNMP OID is clipped at the end. In full it is:
Initially I tried something else, but that did not go so well.
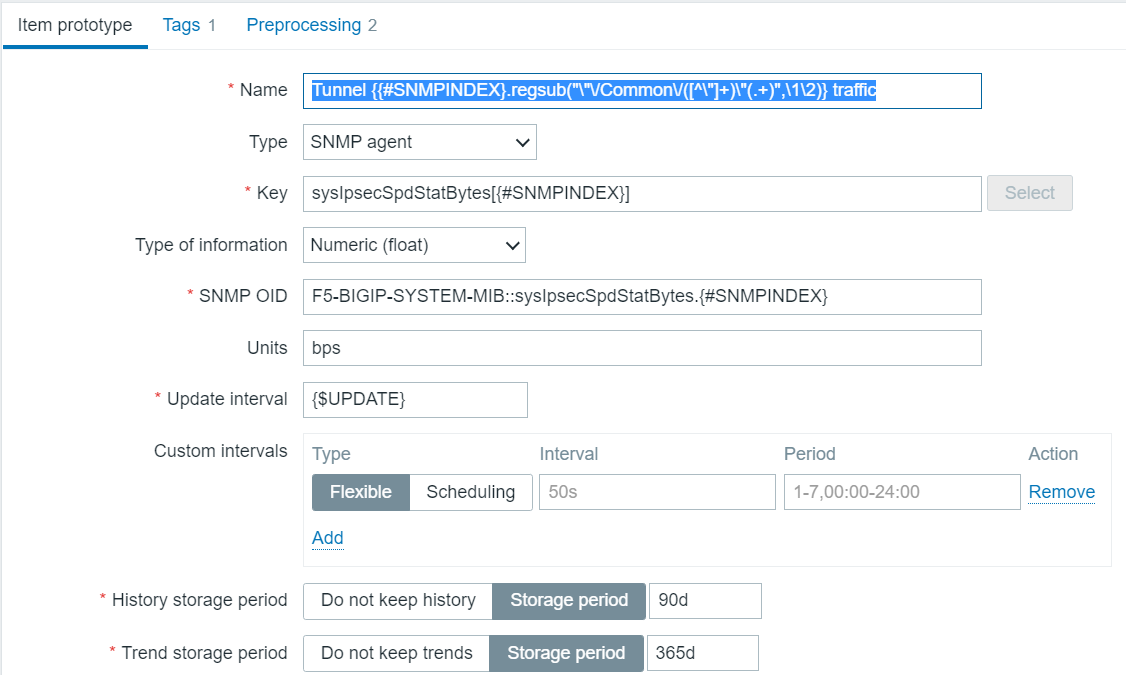
Now we want to know the tunnel status (up or down) and the amount of traffic over the tunnel. We create two item prototypes to get those.
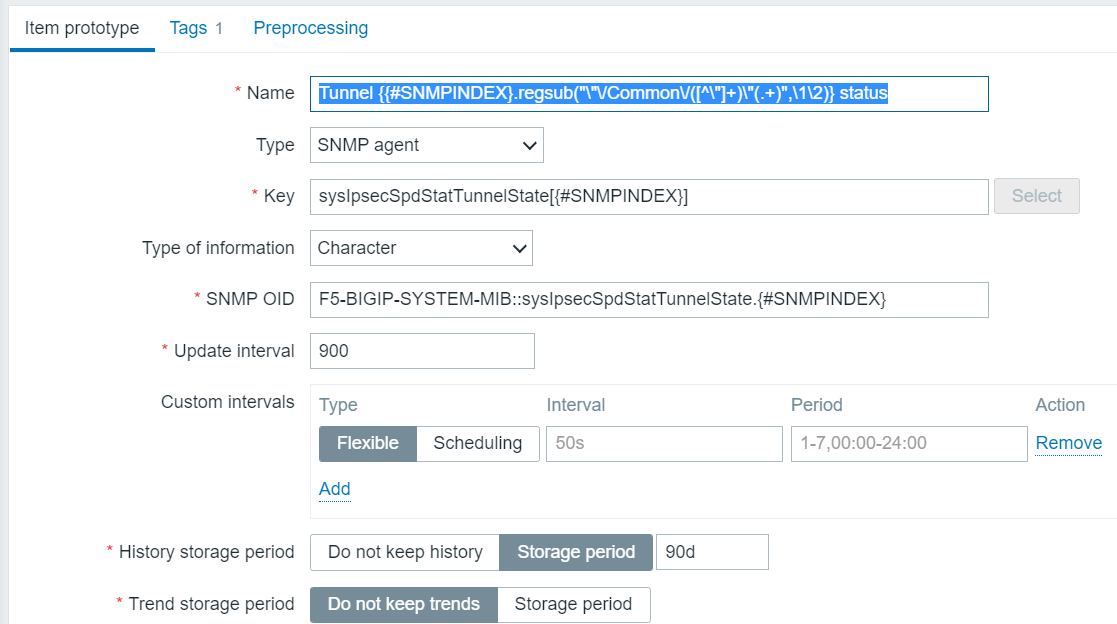
Tunnel Status Item prototype
So, yes, we’re doing some fancy regex to simplify the otherwise ungainly name which would be generated, stripping out the useless stuff with a regsub function, which, by the way, is poorly documented. So that’s how we’re going to discover the statuses of the tunnels. In text, the name is:
Tunnel {{#SNMPINDEX}.regsub(“\”\/Common\/([^\”]+)\”(.+)”,\1\2)} status
I learned how to choose the OID, which is the most critical part, I guess, from a combination of parsing the output of the snmpwalk plus imitation of those other LLD item prortypes, which were writtne by someone more competent than I.
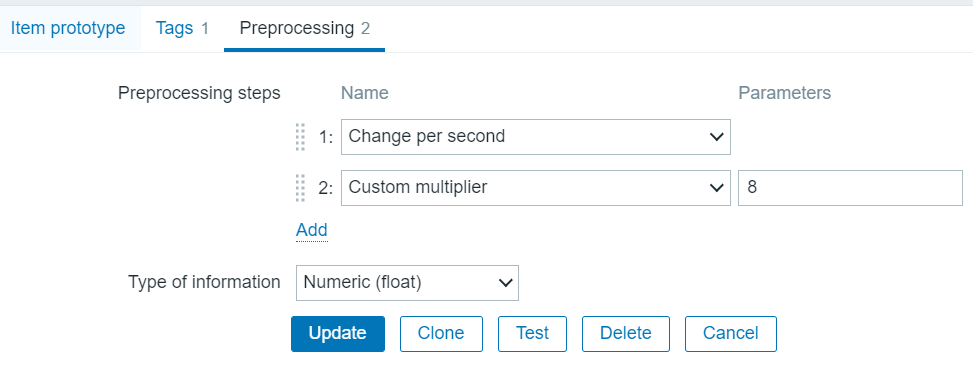
Now the SNMP value for traffic is bytes, but you see I set units of bps? I can do that because of the preprocessing steps which are
Bytes to traffic rate preprocessing steps
Final tip
For these discovery items what you want to do is to disable Create Enabled and disable Discover. I just run it on the F5s which actually have IPSEC tunnels. Execute now actually works and generates items pretty quickly.
Using the api with a token and security by obscurity
I am taking the approach of pulling the token out of a config file where it has been stored, base85 encoded, because, who uses base85, anyway? I call the following script encode.py:
import sys
from base64 import b85encode

s = sys.argv[1]
s_e = s.encode('utf-8')

s64 = b85encode(s_e)
print('s,s_e,s64',s,s_e,s64)
In my case I pull this encoded token from a config file, but to simplify, let’s say we got it from the command line. This is how that goes, and we use it to create the zapi object which can be used in any subsequent api calls. That is the key.
So it’s a few extra lines of code, but the cool thing is that it works. This should be good for version 5.4 and 6.0. Note that if you installed both py-zabbix and pyzabbix, your best bet may be to uninstall both and reinstall just pyzabbix. At least that was my experience going from user/pass to token-based authentication.
Convert DateAndTime SNMP output to human-readable format
Of course this is not very Zabbix-specific, as long as you realize that Zabbix produces the outer skin of the function:
function(value){
function (value) {
// DrJ 2020-05-04// see https://support.zabbix.com/browse/ZBXNEXT-3899 for SNMP DateAndTime format'use strict';//var str = "07 E4 05 04 0C 32 0F 00 2B 00 00";var str = value;// alert("str: " + str);// read values are hexvar y256 = str.slice(0,2);var y = str.slice(3,5);var m = str.slice(6,8);var d = str.slice(9,11);var h = str.slice(12,14);var min = str.slice(15,17);// convert to decimalvar y256Base10 =+("0x"+ y256);// convert to decimalvar yBase10 =+("0x"+ y);var Year =256*y256Base10 + yBase10;// alert("Year: " + Year);var mBase10 =+("0x"+ m);var dBase10 =+("0x"+ d);var hBase10 =+("0x"+ h);var minBase10 =+("0x"+ min);var YR =String(Year);var MM =String(mBase10);var DD =String(dBase10);var HH =String(hBase10);var MIN =String(minBase10);// paddingif(mBase10 <10) MM ="0"+ MM;if(dBase10 <10) DD ="0"+ DD;if(hBase10 <10) HH ="0"+ HH;if(minBase10 <10) MIN ="0"+ MIN;varDate= YR +"-"+ MM +"-"+ DD +" "+ HH +":"+ MIN;returnDate;
// DrJ 2020-05-04
// see https://support.zabbix.com/browse/ZBXNEXT-3899 for SNMP DateAndTime format
'use strict';
//var str = "07 E4 05 04 0C 32 0F 00 2B 00 00";
var str = value;
// alert("str: " + str);
// read values are hex
var y256 = str.slice(0,2); var y = str.slice(3,5); var m = str.slice(6,8);
var d = str.slice(9,11); var h = str.slice(12,14); var min = str.slice(15,17);
// convert to decimal
var y256Base10 = +("0x" + y256);
// convert to decimal
var yBase10 = +("0x" + y);
var Year = 256*y256Base10 + yBase10;
//  alert("Year: " + Year);
var mBase10 = +("0x" + m);
var dBase10 = +("0x" + d);
var hBase10 = +("0x" + h);
var minBase10 = +("0x" + min);
var YR = String(Year); var MM = String(mBase10); var DD = String(dBase10);
var HH = String(hBase10);
var MIN = String(minBase10);
// padding
if (mBase10 < 10)  MM = "0" + MM; if (dBase10 < 10) DD = "0" + DD;
if (hBase10 < 10) HH = "0" + HH; if (minBase10 < 10) MIN = "0" + MIN;
var Date = YR + "-" + MM + "-" + DD + " " + HH + ":" + MIN;
return Date;
I put that javascript into the preprocessing step of a dependent item, of course.
All my real-life examples do not fill in the last two fields: +/-, UTC offset. So in my case the times must be local times. But consequently I have no idea how a + or – would be represented in HEX! So I just ignored those last fields in the SNNMP DateAndTime which otherwise might have been useful.
Here’s an alternative version which calculates how long its been in hours since the last AV signature update.
// DrJ 2020-05-05// see https://support.zabbix.com/browse/ZBXNEXT-3899 for SNMP DateAndTime format'use strict';//var str = "07 E4 05 04 0C 32 0F 00 2B 00 00";var Start =newDate();var str = value;// alert("str: " + str);// read values are hexvar y256 = str.slice(0,2);var y = str.slice(3,5);var m = str.slice(6,8);var d = str.slice(9,11);var h = str.slice(12,14);var min = str.slice(15,17);// convert to decimalvar y256Base10 =+("0x"+ y256);// convert to decimalvar yBase10 =+("0x"+ y);var Year =256*y256Base10 + yBase10;// alert("Year: " + Year);var mBase10 =+("0x"+ m);var dBase10 =+("0x"+ d);var hBase10 =+("0x"+ h);var minBase10 =+("0x"+ min);var YR =String(Year);var MM =String(mBase10);var DD =String(dBase10);var HH =String(hBase10);var MIN =String(minBase10);var Sigdate =newDate(Year, mBase10 -1, dBase10,hBase10,minBase10);//difference in hoursvar difference =Math.trunc((Start - Sigdate)/1000/3600);return difference;
// DrJ 2020-05-05
// see https://support.zabbix.com/browse/ZBXNEXT-3899 for SNMP DateAndTime format
'use strict';
//var str = "07 E4 05 04 0C 32 0F 00 2B 00 00";
var Start = new Date();
var str = value;
// alert("str: " + str);
// read values are hex
var y256 = str.slice(0,2); var y = str.slice(3,5); var m = str.slice(6,8); var d = str.slice(9,11); var h = str.slice(12,14); var min = str.slice(15,17);
// convert to decimal
var y256Base10 = +("0x" + y256);
// convert to decimal
var yBase10 = +("0x" + y);
var Year = 256*y256Base10 + yBase10;
//  alert("Year: " + Year);
var mBase10 = +("0x" + m);
var dBase10 = +("0x" + d);
var hBase10 = +("0x" + h);
var minBase10 = +("0x" + min);
var YR = String(Year); var MM = String(mBase10); var DD = String(dBase10);
var HH = String(hBase10);
var MIN = String(minBase10);
var Sigdate = new Date(Year, mBase10 - 1, dBase10,hBase10,minBase10);
//difference in hours
var difference = Math.trunc((Start - Sigdate)/1000/3600);
return difference;
Calculated bandwidth from an interface that only provides byte count
Again in this example the assumption is you have an item, probably from SNMP, that lists the total inbound/outbound byte count of a network interface – hopefully stored as a 64-bit number to avoid frequent rollovers. But the quantity that really excites you is bandwidth, such as megabits per second.
Use a calculated item as in this example for Bluecoat ProxySG:
change(sgProxyInBytesCount)*8/1000000/300
change(sgProxyInBytesCount)*8/1000000/300
Give it type numeric, Units of mbps. sgProxyInBytesCount is the key for an SNMP monitor that uses OID
IF-MIB::ifHCInOctets.{$INTERFACE_TO_MEASURE}
IF-MIB::ifHCInOctets.{$INTERFACE_TO_MEASURE}
where {$INTERFACE_TO_MEASURE} is a macro set for each proxy with the SNMP-reported interface number that we want to pull the statistics for.
The 300 in the denominator of the calculated item is required for me because my item is run every five minutes.
Alternative
No one really cares about the actual total value of byte count, right? So just re-purpose the In Bytes Count item a bit as follows:
add preprocessing step: Change per second
add second preprocessing step, Custom multiplier 8e-6
The first step gives you units of bytes/second which is less interesting than mbps, which is given by the second step. So the final units are mbps.
Be sure to put the units as !mbps into the Zabbix item, or else you may wind up with funny things like Kmbps in your graphs!
Creating a baseline
Even as of Zabbix v 5, there is no built-in baseline item type, which kind of sucks. Baseline can mean many different things to many people – it really depends on the data. In the corporate world, where I’m looking at bandwidth, my data has these distinct characteristics:
varies by hour-of-day, e.g., mornings see heavier usage than afternoons
there is the “Friday effect” where somewhat less usage is seen on Fridays, and extremely less usage occurs on weekends, hence variability by day-of-week
probably varies by day of month, e.g., month-end closings
So for this type of data (except the last criterion) I have created an appropriate baseline. Note I would do something different if I were graphing something like the solar generation from my solar panels, where the day-of-week variability does not exist.
Getting to the point, I have created a rolling lookback item. This needs to be created as a Zabbix Item of type Calculated. The formula is as follows:
In this example sgProxyInBytesCount is my key from the reference item. Breaking it down, it does a rolling lookback of the last six measurements taken at this time of day on this day of the week over the last six weeks and averages them. Voila, baseline! The more weeks you include the more likely you are to include data you’d rather not like holidays, days when things were busted, etc. I’d like to have a baseline that is from a fixed time, like “all of last year.” I have no idea how. I actually don’t think it’s possible.
But, anyway, the baseline approach above should generally work for any numeric item.
Refinement
The above approach only gives you six measurements, hence 1/sqrt(6) ~ 40% standard deviation by the law of large numbers, which is still pretty jittery as it turns out. So I came up with this refined approach which includes 72 measurements, hence 1/sqrt(72) ~ 12% st dev. I find that to be closer to what you intuitively expect in a baseline – a smooth approximation of the past. Here is the refined function:
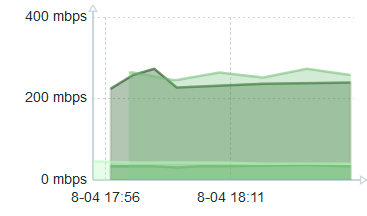
I would have preferred a one-hour interval centered around one week ago, etc., e.g., something like 1w+30m, but such date arithmetic does not seem possible in Zabbix functions. And, yeah, I could put 84600s (i.e., 86400 – 1800), but that is much less meaingful and so harder to maintain. Here is a three-hour graph whose first half still reflects the original (jittery) baseline, and last half the refined function.
Latter part has smoothed baseline in light green
What I do not have mastered is whether we can easily use a proper smoothing function. It does not seem to be a built-in offering of Zabbix. Perhaps it could be faked by a combination of pre-processing and Javascript? I simply don’t know, and it’s more than I wish to tackle for the moment.
Data gap between mulitple item measurements looks terrible in Dashboard graph – solution
In a Dashboard if you are graphing items which were not all measured at the same time, the results can be frustrating. For instance, an item and its baseline as calculated above. The central part of the graph will look fine, but at either end giant sections will be missing when the timescale of display is 30 minutes or 60 minutes for items measured every five minutes or so. Here’s an example before I got it totally fixed.
Zabbix item timing mismatch
See the left side – how it’s broken up? I had beguin my fix so the right side is OK.
The data gap solution
Use Scheduling Intervals in defining the items. Say you want a measurement every five minutes. Then make your scheduling interval m/5 in all the items you are putting on the same graph. For good measure, make the regular interval value infrequent. I use a macro {$UPDATE_LONG}. What this does is force Zabbix to measure all the items at the same time, in this case every five minutes on minutes divisible by five. Once I did that my incoming bandwith item and its corresponding baseline item aligned nicely.
Low-level Discovery
I cottoned on to the utility of this part of Zabbix a little late. Hey, slow learner, but I eventually got there. What I found in my F5 devices is that using SNMP to monitor the /var filesystem was a snap: it was always device 32 (final OID digit). But /var/log monitoring? Not so much. Every device seemed different, with no obvious pattern. Active and standby units – identical hardware – and some would be 53, the partner 55. Then I rebooted a device and its number changed! So, clearly, dynamically assigned and no way was I going to keep up with it. I had learned the numbers by doing an snmpwalk. The solution to this dynamically changing OID number is to use low-level discovery.
Tip: using zabbix_sender in a more robust fashion
We run the Zabbix proxies as pairs. They are not run as a cluster. Instead one is active and the other is a warm standby. Then we can upgrade at our leisure the standby proxy, switch the hosts to it, then upgrade the other now-unused proxy.
But our scripts which send results using zabbix_sender run on other servers. Their data stops being recorded when the switch is made. What to do?
I learned you can send to both Zabbix proxies. It will fail on the standby one and succeed on the other. Since one proxy is always active, it will always succeed in sending its data!
A nice DNS synthetic monitor
It would have been so easy for Zabbix to have built in the capability of doing synthetic DNS checks against your DNS servers. But, alas, they left it out. Which leaves it to us to fill that gap. Here is a nice and simple but surprisingly effective script for doing synthetic DNS checks. You put it in the external script directory of whatever proxy is monitoring your DNS host. I called it dns.sh.
#!/bin/sh
# arg1 - hostname of nameserver
# arg2 - DNS server to test
# arg3 - FQDN
# arg4 - RR type
# arg5 - match arg
# [arg6] - tcpflag # this argument is optional

# if you set DEBUG=1, and debug through zabbix, set item type to text
DEBUG=0
timeout=2 # secs - seems a good value
name=$1
nameserver=$2
record=$3
type=$4
match=$5
tcpflag=$6
[[ "$DEBUG" -eq "1" ]] && echo "name: $name, nameserver: $nameserver , record: $record , type: $type , match pattern: $match, tcpflag: $tcpflag"
[[ "$tcpflag" = "y" ]] || [[ "$tcpflag" = "Y" ]] && PROTO="+tcp"
# unless you set tries to 1 it will try three times by default!
MATCH=$(dig +short $PROTO +timeout=$timeout +tries=1 $type $record @${nameserver} )
[[ "$DEBUG" -eq "1" ]] && echo MATCHed line is $MATCH
return=0
[[ "$MATCH" =~ $match ]] && return=1
[[ "$DEBUG" -eq "1" ]] && echo return $return
echo $return
It gives a value of 1 if it matched the match expression, 0 otherwise.
Conclusion
A couple of really useful but poorly documented items are shared. Perhaps more will be added in the future.
Intro
Scripts are normally not worth sharing because they are so easy to construct. This one illustrates several different concepts so may be of interest to someone else besides myself:
packet trace utility in Checkpoint firewall Gaia
send Ctrl-C interrupt to a process which has been run in the background
giving unqieu filenames for each cut
general approach to tacklnig the challenge of breaking a potentially large output into manageable chunks
The script
I wanted to learn about unexpected VPN client disconnects that a user, Sandy, was experiencing. Her external IP is 99.221.205.103.
while /bin/true; do
# date +%H%M inserts the current Hour (HH) and minute (MM).
 file=/tmp/sandy`date +%H%M`.cap
# fw monitor is better than tcpdump because it looks at all interfaces
 fw monitor -o $file -l 60 -e "accept src=99.221.205.103 or dst=99.221.205.103;" &
# $! picks up the process number of the command we backgrounded just above
 pid=$!
 sleep 600
 #sleep 90
 kill $pid
 sleep 3
 gzip $file
done
while /bin/true; do
# date +%H%M inserts the current Hour (HH) and minute (MM).
file=/tmp/sandy`date +%H%M`.cap
# fw monitor is better than tcpdump because it looks at all interfaces
fw monitor -o $file -l 60 -e "accept src=99.221.205.103 or dst=99.221.205.103;" &
# $! picks up the process number of the command we backgrounded just above
pid=$!
sleep 600
#sleep 90
kill $pid
sleep 3
gzip $file
done
This type of tracing of this VPN session produces about 20 MB of data every 10 minutes. I want to be able to easily share the trace file afterwards in an email. And smaller files will be faster when analyzed in Wireshark.
The script itself I run in the background:
# ./sandy.sh &
And to make sure I don’t get logged out, I just run a slow PING afterwards:
# ping ‐i45 1.1.1.1
Alternate approaches
In retrospect I could have simply used the -ci argument and had the process terminate itself after a certain number of packets were recorded, and saved myself the effort of killing that process. But oh well, it is what it is.
Small tip to see all packets
Turn acceleration off:
fwaccel stat
fwaccel off
fwaccel on (when you’re done).
Conclusion
I share a script I wrote today that is simple, but illustrates several useful concepts.
Intro
I just learned of this really clear explanation of BGP hijacking, including interactive links, and what can be done to improve the current situation, namely, implement RPKI. I guess this weighs on me lately after I learned about another massive BGP hijacking out of Russia. See the references for these links.
References and related
This is the post I was referring to above, very interactive and not too technical. Is BGP Safe Yet?
Intro
This is pretty esoteric, but I’ve personally been waiting for this for a long time. It seems that beginning with openssl 1.1, the s_client sub-menu has had support for a proxy setting. Until then it was basically impossible to examine the certificates your proxy was sending back to users.
Why is it a great thing? If your proxy does SSL interception then it is interfering with with the site’s normal certificate. And worse, it can good. What if its own signing certificate has expired?? I’ve seen it happen, and it isn’t pretty…
To find the openssl version just run openssl version.
My SLES12 SP4 servers have a version which is too old. My Cygwin install is OK, actually. My Redhat 7.7 has a version which is too old. I do have a SLES 15 server which has a good version. But even the version on my F5 devices is too old, surprisingly.
Setup
I decided to run an X Server on my Windows 10 laptop. I only need it for Cognos gateway configuration, but when you need it, you need it. Of course an X Server listens on port 6000, so hosts outside of your PC have to be able to initiate a TCP connection to your PC with destination port 6000. So that port has to be open. The software I use for the X Server is Mobatek XTerm.
Here is the Powershell command to disable the block of TCP port 6000.
The Powershell window needs to be run as administrator. The change is permanent: it suffices to run it once.
Conclusion
And, because inquiring minds want to know, did it work? Yes, it worked and I could send my cogconfig X window to my Mobatek X Server. I had to look for a new Window. It was slow.