Intro
I used the Flux language available within Grafana for my InfluxDB data source to do a number of things which, while easy, are not easy to find. So here I am doing a brain dump to document the language features I’ve so far used, and especially to describe these features with terms common to other more well-known languages such as python.
A word about Flux
Nothing is straightforward when it comes to Flux. And to make matters worse, the terminology is also strange. I am at the beginning level of beginning, so I don’t know their terminology, much less positioned to defend it.
Flux vs InfluxQL
It seems InfluxQL is the old stuff. It had SQL-like statements. Flux syntax seems rather different. But its capabilities have been enhanced. But since flux is a common word I am never sure how to formulate an Internet search. Flux lang? So when you do searches you’ll often see references to the old stuff (SELET statements and the like), which I always avoid.
Versions
I believe, here in June 2023 as I write this, that our InfluxDB is v 2.x, Grafana is version 10 (as of today!), so that gives us Flux v 0.x, I guess???
Time Series data
One has to say a word about time series data. But I’m not the one to say it. I simply muddle along until my stuff comes out as I wish it to. Read this somewhat helpful page to attempt to learn about time series: https://docs.influxdata.com/flux/v0.x/get-started/data-model/
Debugging
Grafana is very helpful in pointing out errors. You create your Flux query, try to refresh, and it throws up a traingular-shaped warning icon which says which exact characters of which exact line of your Flux query it doesn’t like. It it weren’t for this I’d have wasted many more hours beyond the ones already wasted.
Print out variable values to debug
In python I print out variable values to understand what’s happening. I have no idea how to do this in Influx. Of course I’m not even sure variable is the right word.
Example
This working example will be heplful to illustrate some of the things I’ve learned.
import "date"
import "dict"
weekdayDict = [0:"Sunday", 1:"Monday", 2:"Tuesday", 3:"Wednesday", 4:"Thursday",
  5:"Friday", 6:"Saturday"]
regionOffsetDict = ["AP":8h,"NA":-4h,"EU":0h,"SA":-3h]
offset_dur = dict.get(dict:regionOffsetDict, key:"${Region}", default:0h)
startOnToday = date.add(d: -${day}d, to: now())
startCorrected = date.add(d: offset_dur, to: startOnToday)
startTrunc = date.truncate(t: startCorrected, unit: 1d)
stopTrunc = date.add(d: 1d, to: startTrunc)
year = string(v: date.year(t: startTrunc))
month = string(v: date.month(t: startTrunc))
day = string(v: date.monthDay(t: startTrunc))
dayWint = date.weekDay(t: startTrunc)
dayW = dict.get(dict:weekdayDict, key:dayWint, default:"Unknown day")
niceDate = "Date: " + dayW + " "+ year + "-" + month + "-" + day
// see https://docs.influxdata.com/flux/v0.x/stdlib/date/truncate/
// and https://docs.influxdata.com/flux/v0.x/stdlib/universe/aggregatewindow/
from(bucket: "poc_bucket2")
  |> range(start: startTrunc, stop: stopTrunc)
  |> filter(fn: (r) =>
    r._measurement == "vedge" and
    r._field == "percent" and
    r.item == "$item"
  )
  |> keep(columns:["_time","_value","item"])
  |> aggregateWindow(every: 1h, timeSrc: "_start", fn: mean)
  |> set(key:"hi", value:niceDate)
Comment lines
Begin a line with // to indicate it is a comment line. But // can also be used to comment at the end of a line.
Concatenating strings
Let’s start out easy. Concatenating strings is one of the few things which work the way you expect:
niceDate = “Date: ” + dayW + ” “+ year + “-” + month + “-” + day
Variables are strongly typed
Let’s back up. Yes there are variables and they have one of a few possible types and the assignment operator = works for a few simple cases. So far I have used the types int, string, duration, time and dict. Note that I define all my variables before I get to the range statement. Not sure if that’s essential or not. If a function expects a duration, you cannot fake it out by using a string or an int! There are conversion functions to convert from one type to another.
literal string syntax: use double quotes
I’m so used to python’s indifference as to whether your string literals are enclosed by either single quotes or double quotes, and I prefer single quotes. But it’s only double quotes in Flux.
Add an additional column to the table
|> set(key:”hi”, value:niceDate)
Why do this? I want that in my stat visualization, when you hover over a stat, you learn the day and day-of-the-week.
Copy (duplicate) a column
|> duplicate(column: “_value”, as:”value”)
Convert the _value column to a string
I guess this only works on the _value column.
|> toString()
For arbitary conversion to a string:
string = string(v: variable)
But if you’re inside an fn function, you need something like this:
|> map(fn: (r) => ({r with valueString: string(v: r._value)}))
dict
dictionaries are possible. I define weekdayDict,
weekdayDict = [0:”Sunday”, 1:”Monday”,…
then I use it:
dayW = dict.get(dict:weekdayDict, key:dayWint, default:”Unknown day”)
Dates, durations and date arithmetic
I guess it makes sense in a time series to devote a lot of attention to date arithmetic and such. In my script above I do some of the following things:
- truncate the current day down to Midnight
- add a full day to a date
- pull out the year, month, date
- convert a date object to a string
template variables
day is a template variable (I think that’s the term). It is set up as a hidden variable with the (hand-coded) values of 0,1,2,3,4,…32.
dropping columns
We all know about the drop(columns:[…, but how about if you have so many columns it’d be more economical to simply keep the ones you need? That is my situation, hence the line:
|> keep(columns:[“_time”,”_value”,”item”])
Lumping data together into every hour, aka data aggregation or windowing
|> aggregateWindow(every: 1h, timeSrc: “_start”, fn: mean)
Note the keep columns is in fron of the aggregation. Things didn’t turn out so well if I flipped the order.
Adding additional columns
|> set(key:”hi”, value:niceDate)
So when you hover over a row with the mouse, this will produce a pleasant Wednesday 2023-6-14
Appending additional series together
I have had success with union when the tables all had the same colunms.
union(tables: [meanTbl,n95Tbl,maxTbl])
Outputting additional series
Use yield. Let’s say you’ve outputted one table and want to output a second table based on different criteria. The second table can be output using
|> yield(name: “second”)
Regular Expressions (RegEx)
Should be supported. I haven’t had opportunity to use them yet however.
A short word on what I’m doing
I have a stat visualization where the stat blocks repeat vertically and there are 24 per row. Get it? Each stat contains a single number representing the value for that hour of the day. Then there is a repeat over template variable day.
Just above this panel is another thin panel which contains the numbers 0 through 23 so you know which hour of the day it is. That is another stat visualization which contains this code:
import "generate"
data = generate.from(
  count: 24,
  fn: (n) => n,
  start: 2021-01-01T00:00:00Z,
  stop: 2021-01-06T00:00:00Z,
)
data
  |> range(start: 2021-01-01T00:00:00Z, stop: 2021-01-24T05:00:00Z)
  |> set(key:"hi", value:"local vEdge hour")
Generate your own test data – generate.from()
The non-intuitive code snippet above shows one example of generating my own data into a table which is used to display stat blocks which contain 0, 1, 2, …, 23 and when you mouseover the pop-up text says “local vEdge hour.” The time references are mostly throw-away dummy values, I guess.
Loops or iterations
Flux sucks when it comes to program loops. And say yuo wanted nested loops? Forget about it. It’s not happening. I have no idea how to do a simple loop. I know, seriously? Except I only needed it for the data generation where I do show how to do it within a generate.from code block.
Refer to the time picker’s time range
This is surprisingly hard to find. I don’t know why.
|> range(start: v.timeRangeStart, stop: v.timeRangeStop)
Setting Grafana time picker to a stop time in the future
This is actually a Grafana thing, but since I’m on a roll, here goes. From now-5d To now+10h
Is Flux only good for Grafana?
No. They have made it its own stand-alone thing so it could be used in other contexts.
How to subtract two times
Intuitively since there is a date.add function you would expect a date.sub function so that you cuold subtract two times and get a duration as a result. But they messed up and omitted this obvious function. Also, just for the record, the subtract operator is not overloaded and therefor you canno simply do a c = b – a if a and b are of type time. You will get a
invalid: error @4:5-4:10: time is not Subtractable
Yet I wanted to do a comparison of the difference between two times and a known duration. How to do it? So what you can do is convert the two times into, e.g., day of the year with a date.yearDay function. The days are integers. Then subtract them and compare the difference to another integer (representing the number of days in this example) using simple integer comparison operator such as >.
Is flux dead?
Now, in October 2023, when I get online help on flux I see this information:
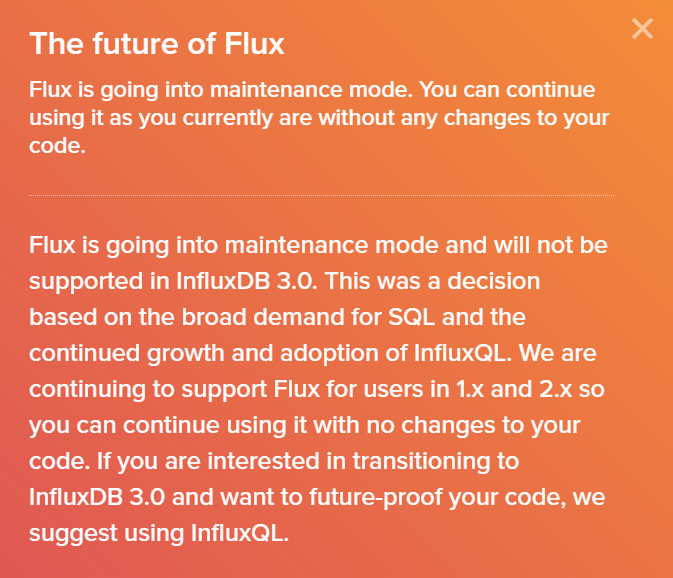
I have a lot invested in flux at this point so this could be a huge development for me. I’m seeking to get more details.
References and related
Time Series Intro – somewhat helpful