Intro
Since they took away our Visio license to save licensing fees, some of us have wondered where to turn to. I once used the venerable old MS Paint after learning one of my colleagues used it. Some have turned to Powerpoint. Since I had some time and some previous familiarity with the components – for instance when I create CAD designs for 3D printing I am basically also doing CAD as code using openSCAD – I wondered if I could generate my network diagram using code? It turns out I can, at least the basic stuff I was looking to do.
Pillow
I’m sure there are much better libraries out there but I picked something that was very common although also very limited for my purposes. That is the python Pillow package. I created a few auxiliary functions to ease my life by factoring out common calls. I call the auxiliary modules aux_modules.py. Here they are.
from PIL import Image, ImageDraw, ImageFont
serverWidth = 100
serverHeight = 40
small = 5
fnt = ImageFont.truetype('/usr/share/fonts/truetype/dejavu/DejaVuSans.ttf', 12)
fntBold = ImageFont.truetype('/usr/share/fonts/truetype/dejavu/DejaVuSans-Bold.ttf', 11)

def drawServer(img_draw,xCorner,yCorner,text,color='white'):
# known good colors for visibility of text: lightgreen, lightblue, tomato, pink and of course white
# draw the server
    img_draw.rectangle((xCorner,yCorner,xCorner+serverWidth,yCorner+serverHeight), outline='black', fill=color)
    img_draw.text((xCorner+small,yCorner+small),text,font=fntBold,fill='black')

def drawServerPipe(img_draw,xCorner,yCorner,len,source,color='black'):
# draw the connecting line for this server. We permit len to be negative!
# known good colors if added text is in same color as pipe: orange, purple, gold, green and of course black
    lenAbs = abs(len)
    xhalf = xCorner + int(serverWidth/2)
    if source == 'top':
        coords = [(xhalf,yCorner),(xhalf,yCorner-lenAbs)]
    if source == 'bottom':
        coords = [(xhalf,yCorner+serverHeight),(xhalf,yCorner+serverHeight+lenAbs)]
    img_draw.line(coords,color,2)

def drawArrow(img_draw,xStart,yStart,len,direction,color='black'):
# draw using several lines
    if direction == 'down':
        x2,y2 = xStart,yStart+len
        x3,y3 = xStart-small,y2-small
        x4,y4 = x2,y2
        x5,y5 = xStart+small,y3
        x6,y6 = x2,y2
        coords = [(xStart,yStart),(x2,y2),(x3,y3),(x4,y4),(x5,y5),(x6,y6)]
    if direction == 'right':
        x2,y2 = xStart+len,yStart
        x3,y3 = x2-small,y2-small
        x4,y4 = x2,y2
        x5,y5 = x3,yStart+small
        x6,y6 = x2,y2
        coords = [(xStart,yStart),(x2,y2),(x3,y3),(x4,y4),(x5,y5),(x6,y6)]
    img_draw.line(coords,color,2)
    img_draw.line(coords,color,2)

def drawText(img_draw,x,y,text,fnt,placement,color):
# draw appropriately spaced text
    xy = (x,y)
    bb = img_draw.textbbox(xy, text, font=fnt, anchor=None, spacing=4, align='left', direction=None, features=None, language=None, stroke_width=0, embedded_color=False)
# honestly, the y results from the bounding box are terrible, or maybe I don't understand how to use it
    if placement == 'lowerRight':
        x1,y1 = (bb[0]+small,bb[1])
    if placement == 'upperRight':
        x1,y1 = (bb[0]+small,bb[1]-(bb[3]-bb[1])-2*small)
    if placement == 'upperLeft':
        x1,y1 = (bb[0]-(bb[2]-bb[0])-small,bb[1]-(bb[3]-bb[1])-2*small)
    if placement == 'lowerLeft':
        x1,y1 = (bb[0]-(bb[2]-bb[0])-small,bb[1])
    xy = (x1,y1)
    img_draw.text(xy,text,font=fntBold,fill=color)
How to use
I can’t exactly show my eample due to proprietary elements. So I can just mention I write a main program making lots of calls tto these auxiliary functions.
Tip
Don’t forget that in this environment, the x axis behaves like you learned in geometry class with positive x values to the right of the y axis, but the y axis is inverted! So positive y values are below the x axis. That’s just how it is in a lot of these programs. get used to it.
What I am lacking is a good idea to do element groupings, or an obvious way to do transformations or rotations. So I just have to keep track of where I am, basically. But even still I enjoy creating a network diagram this way because there is so much control. And boy was it easy to replicate a diagram for another one which had a similar layout.
It only required the Pillow package. I am able to develop my diagrams on my local PC in my WSL environment. It’s nice and fast as well.
Example Output
This is an example output from this diagram as code approach which I produced over the last couple days, sufficiently blurred for sharing.
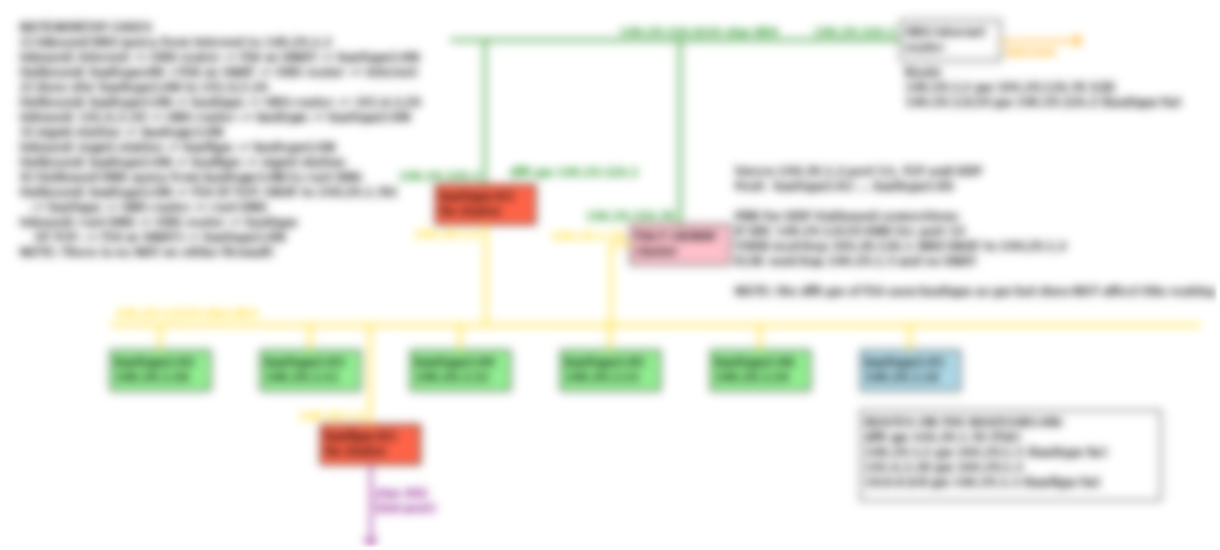
Conclusion
I provide my auxiliary functions which permit creating “network diagrams as code.” The results are not pretty, but networking people will understand them.
References and related
I developed a way to blur images using the Python Pillow package.
My disorganized cheat sheet of python language features I most commonly use.