Intro
I panned Zabbix in this post: DIY monitoring. But I have compelling reasons to revisit it. I have to say it has matured, but there remain some very frustrating things about it, especially when compared with SiteScope (now owned by Microfocus) which is so much more intuitive.
But I am impressed by the breadth of the user base and the documentation. But learning how to do any specific thing is still an exercise in futility.
I am going to try to structure this post as a problems encountered, and how they were resolved.
Current production version as of this writing?
Answer: 6.0
Zabbix Manual does not work in Firefox
That’s right. I can’t even read the manual in my version of Firefox. Its sections do not expand. Solution: use Chrome
Which database?
You may see references to MYSQL in Zabbix docs. MYSQL is basically dead. what should you do?
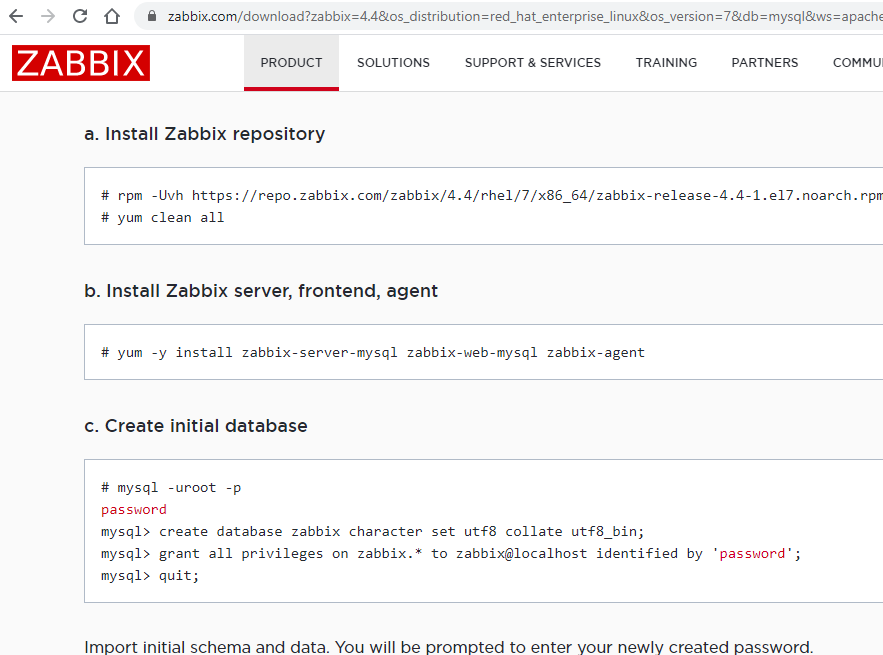
Answer
Install mariadb which has replaced MYSQL and supports the same commands such as the mysql from the screenshot. On my Redhat instance I have installed these mariadb-related repositories:
mariadb-5.5.64-1.el7.x86_64 mariadb-server-5.5.64-1.el7.x86_64 mariadb-libs-5.5.64-1.el7.x86_64 |
Terminology confusion
what is a host, a host group, a template, an item, a web scenario, a trigger, a media type?
Answer
Don’t ask me. When I make progress I’ll post it here.
Web scenario specific issues
Can different web scenarios use different proxies?
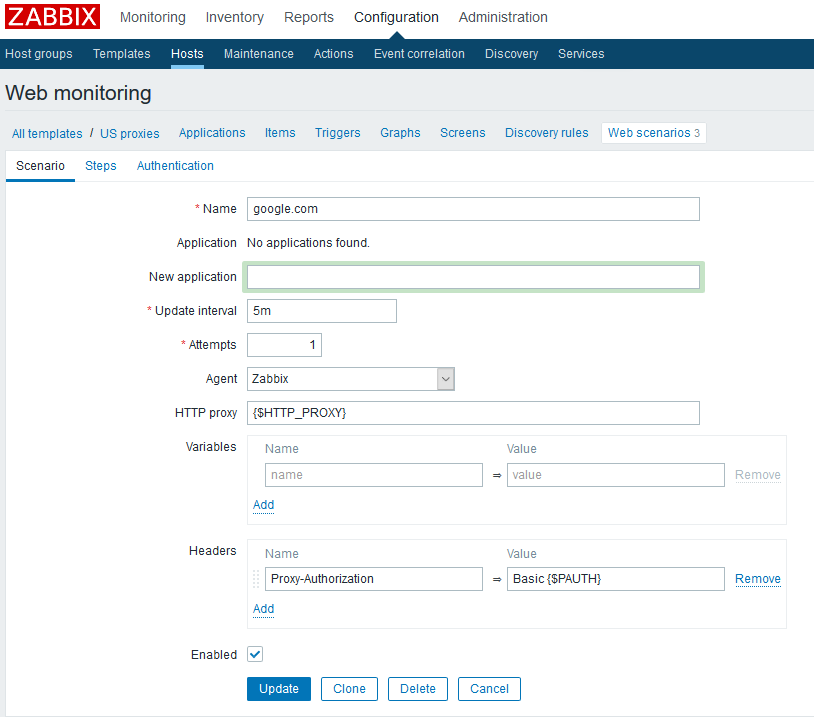
Answer: Yes, no problem. In really old versions this was not possible. See web scenario screenshot below.
Can the proxy be a variable so that the same web scenario can be used for different proxies?
Answer: Yes. Let’s say you attach a web scenario to a host. In that host’s configuration you can define a “macro” which sets the variable value. e.g., the value of HTTP_PROXY in my example. I think you can do the same from a template, but I’m getting ahead of myself.
Similarly, can you do basic proxy auth and hide the credentials in a MACRO? Answer: I think so. I did it once at any rate. See above screenshot.
Why does my google.com web scenario work whereas my amazon.com scenario not when they’re exactly the same except for the URL?
Answer: some ideas, but the logging information is bad. Amazon does not take to bots hitting it for health check reasons. It may work better to change the agent type to Linux|Chrome, which is what I am trying now. Here’s my original answer: Even with command-line curl I get an error through this proxy. That can’t be good:
$ curl ‐vikL www.amazon.com
... NSS error -5961 (PR_CONNECT_RESET_ERROR) * TCP connection reset by peer * Closing connection 1 curl: (35) TCP connection reset by peer |
My amazon.com web scenario is not working (status of 1), yet in dashboard does not return any obvious warning or error or red color. Why? Answer: no idea. Maybe you have to define a trigger?
Say you’re on the Monitoring|latest data screen. Does the data get auto-updated? Answer: yes, it seems to refresh every 30 seconds.
In Zabbix Latest Data can you control the history displayed via url parameters? By default only one hour of history is displayed. Answer: There is an undocumented feature I have discovered which permits this. Let’s say your normal URL for your direct link to the latest data of item 1234 is https://drjohns.com/history.php?action=showgraph&itemids[]=1234. The modified version of that to display the last day of data is: https://drjohns.com/history.php?action=showgraph&from=now-1d&to=now&itemids[]=1234
In latest data viewing the graph for one item which has a trigger, sometimes the trigger line is displayed as a dashed line and sometimes not at all. Answer: From what I can tell the threshold line is only displayed if the threshold was entered as a number in the trigger condition. Strange. Unfortunate if true.
Why is the official FAQ so useless? Answer: no idea how a piece of software otherwise so feature-rich could have such a useless FAQ.
Zabbix costs nothing. Is it still actively supported? Answer: it seems very actively supported for some reason. Not sure what the revenue model is, however…
Can I force one or more web scenarios to be run immediately? I do this all the time in SiteScope. Answer: I guess not. There is no obvious way.
Suppose you have defined an item. what is the item key? Answer: You define it. Best to make it unique and use contiguous characters. I’m seeing it’s very important…
What is the equivalent to SiteScope’s script monitors? Answer: Either ssh check or external check.
How would you set up a simple PING monitor, i.e., to see if your host is up? Answer: Create an item as a “simple check”, e.g., with the name ping this host, and the key icmpping[{HOST.IP},3]. That can go into a template, by the way. If it succeeded it will return a 1.
I’ve made an error in my script for an external check. Why does Latest data show nothing at all? Answer: no idea. If the error is bad enough Zabbix will disable the item on you, so it’s not really running any longer. But even when it doesn’t do that, a lot of times I simply see no output whatsoever. Very frustrating.
Help! The Latest Data graph’s Y axis only shows 0’s and 5’s. Answer: Another wonderful Zabbix feature, this happens because your Units are too long. Even “per minute” as Units can get you into trouble if it is trying to draw a Y axis with values 22.0 22.5 23.0, etc: you’ll only see the .0’s and the .5’s. Change units to a maximum of seven characters such as “per min.”
Why is the output from an ssh check truncated, where does the rest go? Answer: no idea.
How do you increase the information contained in the zabbix server log? Let’s say your zabbix server is running normally. Then run this command: zabbix_server ‐R log_level_increase
You can run it multiple times to keep increasing the verbosity (log level), I think.
Attempting to use ssh items with key authentication fails with :”Public key authentication failed: Callback returned error” Initially I thought Zabbix was broken with regards to ssh public key authentication. I can get it to work with password. I can use my public/private key to authenticate by hand from command-line as root. Turns out running command such as sudo -u zabbix ssh … showed that my zabbix account did not have permissions to write to its home directory (which did not even exist). I guess this is a case of RTFM, because they do go over all those steps in the manual. I fixed up permissions and now it works for me, yeah.
Where should the scripts for external checks go? In my install it is /usr/lib/zabbix/externalscripts.
Why is the behaviour of triggers inconsistent. sometimes the same trigger has expected behaviour, sometimes not. Answer: No idea. Very frustrating. See more on that topic below.
How do you force a web scenario check when you are using templates? Answer: No idea.
Why do (resolved) Problems disappear no matter how you search for them if they are older than, say, 30 minutes? Answer: No idea. Just another stupid feature I guess.
Why does it say No media defined for user even though user has been set up with email as his media? Answer: no idea.
Why do too many errors disable an ssh check so that you get Status Disabled and have no graceful way to recover? Answer: no idea. It makes sense that Zabbix should not subject itself to too many consecutive errors. But once you’ve fixed the underlying problem the only recovery I can figure is to delete the item and recreate it. or delete the host and re-create it. Not cool.
I heard dependent items are the way to go to parse complex data coming out of a rich text item. How do you do that? Answer: Yes they are. I have gotten them to work and really give me the fine-grained control I’ve always wanted. I hope to show a real-life example soon. To get started creating a dependent item you can right-click on the dots of an item, or create a new item and choose type Dependent Item.
I am looking at Latest data and one item is grayed out and has no data. Why? Answer: almost no idea. This happens to me in a dependent item formed by a regular expression where the regular expression does not match the content. I am trying to make my RegEx more flexible to match both good and error conditions.
Why do my dependent items, when running a Check Now, say Cannot send request: wrong data type, yet they are producing data just fine when viewed through Latest data? Answer: this happens if you ran a Check Now on your template rather than when viewing an individual host. Make sure you select a host before you run Check Now. Actually, even still it does not work, so final answer: no idea.
Why do some regular expressions check out just fine on regex101.com yet produce a match for value of type “string”: pattern does not match error in Zabbix? Answer: Some idea. Fancy regular expressions do not seem to work for some reason.
Every time I add an item it takes the absolute maximum amount of time before I see data, whether or not I run check Now until I turn blue in the face. Why? Answer: no idea. Very frustrating.
If the Zabbix server is in one time zone and I am in another, can I have my view of timestamps customized to my time zone? Otherwise I see all times in the timezone of the Zabbix server. Answer: You are out of luck. The suggestion is to run two GUIs, one in your time zone. But there is a but. Support for this has been announced for v 5.20. Stay tuned…
My DNS queries using net.dns don’t do anything. Why? Answer: no idea. Maybe your host is not running an actual Zabbiox agent? That’ll do it. Forget that net.dns check if you can’t install an agent. Zabbix has no agentless DNS monitor for some strange reason.
A DNS query which returns many address records fails (such as querying an AD domain), though occasionally succeeds. Why? Answer: So your key looks something like this, right? net.dns.record[10.1.2.3,my-AD-domain.net,A,10,2,tcp]. And when you do the query through dig it works fine, right? E.g., dig +tcp my-AD-domain.net @10.1.2.3. And you’ve set the Zabbix response to type text? It seems to be just another Zabbix bug. You may have to use a script instead. Zabbix support has been able to reproduce this bug and they are working on it as we speak.
What does Check/Execute Now really do? Answer: essentially nothing as far as I tell. It certainly doesn’t “check now”, i.e., force the item to be run. However, if you have enough permissions, what you can do when you’re looking at an item for a specific Host is to run Test. Then Get Value. I usually get Permission Denied, however.
I want to show multiple things on a dashboard widget graph like an item plus its baseline (Ed: see references for calculating a baseline). What’s the best way? Answer: You can use the add new data set feature for instance to add your baseline. In your additional data set you put your baselines. Then I like to make the width 2, transparency 0 and fill 0. This will turn it into a thin bold line with a complementary color while not messing too much with the original colors of your items. The interface is squirrely, but, hey, it’s Zabbix, what did you expect?
I have a lot of hosts I want to add to a template. Does that Mass Update feature actually work? Answer: yes. Use it. It will save you time.
Help! I accidentally deleted an entire template. I meant to just delete one of its macros. Is there a revert? Answer: it doesn’t look like it. Hope you remember what you did…
It seems if I choose units in an item which have too many characters, e.g., client connections, the graph (in Latest Data) cuts it off and doesn’t even display the scale? Answer: seems so. It’s a bug. This won’t happen when using vector graphs in Dashboard. The graphs in Latest Data are PNG and limited to short Units, e.g., mbps. Changing to vector graphs has been in the roadmap but then disappeared.
Can I create a baseline? Nope. It’s on the roadmap. However, see this clever idea for building one on your own without too much effort.
I’ve put a few things on the same Dashboard graph. Why don’t they align? There are these big gaps. Zabbix runs the items when it feels like, and the result is gaps in data which Zabbix makes no attempt to conceal at the beginning and end of a graph. You can use Scheduling Intervals on your items to gain some control over this. See this article for details.
Besides cloning the whole thing, how can I change the name of a Dashboard? Answer: If you just click to edit a Dashboard the name appears fixed. However, click on the gear icon and that gives you the option to edit the dashboard name. It’s kind of an undocumented feature.
My SNMP MIB has bytes in/out for an interface when what I really want is bandwidth, i.e., Megabits per second. A little preprocessing on a 64-bit bytes value and you are there (32 bit values may roll over too frequently). See this article for details.
In functions like avg (sec|#num,<time_shift>), why is the time_shift argument so restricted? It can’t be a macro, contain a formula like 1w-30m, or anything semi-sophisticated. It just accepts a dumb literal like 5h? Answer: It’s just another shortcoming in Zabbix. How much did you pay for it? 🙂
I have an SNMP template with items for a hostgroup of dispersed servers. Some work fine. The one in Asia returns a few values, but not all. I am using Bulk Request. Answer (to your implied question!) You must have bad performance to that one. Use a Zabbix proxy with a longer timeout for SNMP requests. I was in that situation and that worked for me.
SNMPv3 situation. I have two identical virtual servers monitored by the same Zabbix proxy. Only one works. Command-line testing of snmpwalk looks fine. What could it be?’Answer: We are fighting this now. In our case the SNMP v3 engineIDs are identical on the two virtual servers because they were from the same image, whereas, if you read the specs, they are supposed to be unique, like a MAC address. Who knew? And, yes, once we made the engineIDs unique, they were fine in Zabbix.
Riddle: when is 80% not 80%? Answer: when pulling in used storage on a filesystem via SNMP and comparing it to storage size! I had carefully gotten a filesystem 83% full based on the output of df -m. But my trigger, set to go off at 80%, never went off. How could it be? The 83% includes some kind of reserved user space on the filesystem which is not included when you do the calculation directly. So I was at 78% or so in actuality. I changed the trigger to 75%.
My trigger for a DNS item, which relies on a simple diff(), goes off from time-to-time yet the response is the same. Why? Answer: We have seen this behavior for a CNAME DNS item. The response changed the case of the returned FQDN from time-to-time, and that is enough to set off the Zabbix diff()-based trigger! We pre-processed the output with a RegEx to just get the bits we wanted to examine to fix this.
Related question. My diff() trigger for a DNS item does NOT go off when the server actually goes down. What’s up with that? Answer: Although you might expect a suddenly unavailable server constitutes a “difference,” in Zabbix’s contorted view of reality it does not. I recommend an additional trigger using the function nodata().
Does the new feature of login using SAML actually work? Answer: Yes, we are using it in Zabbix v 5.0.
My OIDs for my filesystems keeps shifting around. What to do? Answer: Use low-level discovery. It’s yet another layer of abstraction and confusion, but it’s probably worth it. I intend to write up my approach in my practical Zabbix examples blog post.
After an Zabbix agent item goes bad (no data), Zabbix refuses to test it for a full 30 minutes after it went bad, despite an update interval of 5 minutes. Why? Answer: In one of the worst architectural decisions of all time, Zabbix created the concept of unsupported items. It works something like this: the very moment when you need to be told Hey there’s something wrong here is when Zabbix goes quiet. Your item became unsupported, which is like being in the penalty box for 30 minutes, during which time nothing works like you naively expected it to. Even the fact that your item became unsupported is almost impossible to find out from a trigger. An example of software which treats this situation correctly is Microfocus SiteScope. In Zabbix in version 5.0 there’s a global timeout for all unsupported items. Ours is set to 30 minutes, you see. In some cases that may make sense and prevent Zabbix from consuming too many resources trying to measure things which don’t work. I find it annoying. For DNS, specifically, best to use a key of type net.dns and not net.dns.record. That returns a simple 0 or 1 and does not become unsupported if the dns server can’t be reached. V 5.2 will provide some more options around this issue. For a HTTP agent and I suppose many other items, it’s best to create triggers which use the nodata() function, which can somewhat compensate for this glaring weakness in Zabbix. If you run Zabbix v 5.2, you should use the new preprocessing rule “Check for not supported value” and then set new value e.g. “Error”. Then the Item won’t become unsupported and can also be used for triggers.
We’ve got SNMP items set up for a host. What’s the best way to alert for a total outage? Answer: I just learned this. This is closely related to the previous question. To avoid that whole unsupported item thing, you make a Zabbix internal item. the key is literally this: zabbix[host,snmp,available] and type is numeric unsigned. This wil continue to poll even if the other host items became unsupported. This is another poorly documented Zabbix feature.
While trying to set up a host for SNMP monitoring I get the error Cannot update Host. Cannot find host interface on host_name for item key item_name. Answer: You probably used an interface type of Agent instead of SNMP. Under Interfaces for the host, add one for type SNMP and remove the Agent one. Or, maybe the reverse: your item type is of type Zabbix agent but your host’s interface is of type SNMP – that combo also produces this error.
In Zabbix my SNMP item shows error No such instance currently exists at this OID, yet my snmpwalk for same shows it works. Why? Answer: In my case I switched to snmpget for my independent testing and reproduced that error, and found that I needed a literal .”0″ at the end of the OID (specifically for swap used on an F5 device). Once I included the .”0″ (with the double-quotes) in the OID in Zabbix it began to work. In another case I could do the snmpget from the same zabbix proxy where I was getting this error message. The custom MIB was right there in /usr/share/snmp/mibs on the Zabbix proxy. Zabbix hadn’t been started in awhile. I restarted it and the problem went away.
I wish to use a DNS value instead of an IP in net.tcp.service[service,IP,port] because I use geoDNS or round-robin DNS. Can I? Answer: It seems to work, yes.
Can I send alerts to MS teams? Answer: This is obviously a fake question. But the answer is Yes. You set up a Connector in a MS Teams channel. It’s pretty staight forward and it’s pretty cool. I’ll try to publish more in my Zabbix tips post if I have time.
Get a lot of false positives? Answer: Yes! On F5 equipment this one is vexing me:
And for others (pool member unavailable for a few minutes) I tried to require two consecutive failures before sending an alert. Basically still working on it.
I have a bunch of HTTP items on this one Zabbix proxy. They all sort of go bad at the same time (false positives) and Zabbix says this agent is unreachable for five minutes around the same time. Answer: Seen that. Short term it may be advisable to create a dependent trigger: https://www.zabbix.com/documentation/5.0/manual/config/triggers/dependencies Mid-term I am going to ask support about this problem.
Why is the name field truncated in Monitoring | Latest Data, with no possibility to increase it? Answer: If you have Show Details selected you see very few characters. Deselect that.
What, Zabbix version 5.2 RPMs are not available for RHEL 7? Answer: that is correct, unfortunately, as of this writing. You can run as high as v 5.0.7. We are trying to pressure them to provide this compatibility. Lots of people still run Redhat v 7.
Can you send reminder alerts periodically for a problem which persists? Answer: Yes you can. For instance, every four hours. Read all about it in the manual, under Action | Escalations, and look at their examples. However, the documentation is at odds with the product’s behaviour if you have multiple alerts with different durations defined. I am studying it…
Is Zabbix affected by the same hack that infected SolarWinds? Answer: No idea. Let’s see. Developed in Eastern Europe. Basically, no one’s saying. Let’s hope not.
Is Zabbix stupid enough to send multiple alerts for the same problem? Answer: In a word, yes. If you are unlucky enough to have defined overlapping alert conditions in your various alerts, Zabbix will make no effort to consolidate them.
What does it mean when I look at a host and I see inaccessible template? Answer: Most likely explanation is that you don’t have permission to see that template.
Can the y-axis be drawn in a logarithmic scale in a dashboard graph? I have low values (time for a DNS query) which sometimes soar to high ones. Answer: No. This feature has been requested now for almost 10 years and still is lacking. I will try to make a feature request.
Why does our Zabbix agent time out so often? The message is Zabbix agent on hostname is unreachable for five minutes. The problem is sporadic but it really interferes with the items like our simple net.dns checks. Answer: If you use a lot of net.dns agent items you can actually cause this behavior if you are running agent2. The default agent item is passive. We had better luck using an Active Agent item. We had severe but random timeouts and they all went away.
Our Webhook to MS Teams was working fine. Then we set up a new one to a new channel which wouldn’t work at all. A brief error message says invalid Webhook or something. What’s the fix? Answer: It is a known bug which is fixed in v 5.0.8. Of course a lot else could be wrong. In fairness Microsoft changes the format for webhooks from time-to-time so that could be the problem. This Microsoft page is a great resource to do your own testing of the Webhook: Sending messages to Connectors and Webhooks – Teams | Microsoft Docs
The formatting of alert emails is screwy, especially with line breaks in the wrong places. Can I force it to send HTML email to gain more control? Answer: Sort of. You can define a media type where you use HTML email instead of plain text email. I personally don’t have access to do that. But it is not possible to selectively use HTML email within the Custom email form of the alert setup screen. With the more straightforward custom emails, the trick is to put in extra line breaks. A single solitary linebreak is sometimes ignored, especially if the sequence is MACRO-FUNCTION linebreak more text. But if you use two consecutive linebreaks it will inject two linebreaks.
I swear Zabbix is ignoring my macros in trigger functions used in templates which refer to time values in minutes, and just filling in 0 instead. Is that even possible? Answer: I’m still investigating this one. I will withold my customary sardonic comments about Zabbix until I know who or what is to blame. [Later] I’m thinking this one is on me, not Zabbix.
Do Zabbix items, particularly HTTP items, have the concept of a hidden field to hide confidential data such as passwords from others with the same level of access? Answer: Apparently not. But if you believe in the terrible idea of security by obscurity, you can obscure values by stuffing them into a macro.
My Zabbix admin won’t let me get creative. No external items, no ssh items, etc. I can run some interesting scripts on my linux server. How to stuff the results into Zabbix? Answer: Install zabbix_sender utility on your linux. Then set up an item of type Zabbix trapper. The link to the RPM for zabbix_sender is in the references.
These days nothing is either black or white. So when a trigger fires, it’s likely it will return to good status, and then bad, and then good, etc. The alerts are killing us and casual users tend to discount all of them. What to do? Answer: This is common-sense, but, a very good strategy in these cases is to define a recovery expression for that trigger that looks at the average value for the last 3600 seconds and requires it to be in the good range before the trigger that all is good gets sent out as an alert.
I’m using the dynamic host feature in a dashboard. Unfortunately, one of my hosts has a really short name that matches so many other hosts that it never appears in the drop-down list. What to do? Answer: Click the “select” button to the right of the search field. Then you can choose the host group and from there the host. Or rename the host to somethng more unique.
I wish to add some explanatory text in the dashboard I’ve created. Is it possible? Answer: This is laughably kludgy, but you can do this with a map widget. What you can do is to create a map, add a text box to it, and put your desired text into the text box. But it is hard to get the sizing correct as things shrink when putting the widget on the dashboard.
My top hosts widget is now displaying 0’s. Answer: This happened after we upgraded from v 6.0 to 6.0.8. In characteristically Zabbix illogical fashion, if you now sort by BottomN instead of TopN you should see the expected results (highest on top). Not all our widgets displayed this bug!
I have an item which only runs once a week. Monitoring > Latest Data doesn’t show any values. Is that a bug or feature? Answer: There is a setting somewhere where you can change this behavior. Set it to last two weeks and all will be well.
While using the pyzabbix Zabbix api I had trouble switching from username/password to use an authentication token. Answer: Perhaps yuo installed both py-zabbix as well as pyzabbix? I’m confused by this. as there is some overlap. To use the token auth method – preferred by experts – uninstall both these packages and re-install only pyzabbix. I will give an example in my other Zabbix blog post, Practical Zabbix examples.
The trigger.create api call says a dependent triggerid must be passed? Is that really mandatory? It makes no sense. Answer: No. I experimented with it and found you can just leave the dependencies out altogether. The documentation is wrong.
I need to create about 100 custom alerts. Is there seriously no way to do this via the api? Answer: apparently not.
What’s the correct way to send a compound filter expression via the api? Answer: Watch out! If you are trying to filter on suppressed problems, do not put a reference to suppressed in your filter. Instead it goes outside the filter like so: zapi.problem.get(…,suppressed=False,filter={‘name’:…})
Monitoring > Problems > History view is slow. Then it grays out periodically. Answer: Zabbix is spending all its time figuring out which host groups you have access to. To speed things up, explicitly enter only your accessible host groups in the filter.
geoMAP in Zabbix 6.0 is cool until you blow up a continent and see all the local geographical names written in their native language. So Asian placenames are inscrutable to Enlgih speakers. Is there any fix? Answer: You are probably using the provider, OpenStreetMap in this case, which is using localized names. You can switch providers (global setting).
I’m using a RegEx in the regsub function on an LLD macro. What flavor of RegEx are supported and what characters need to be escaped? Answer: Supposedly Perl-compatible (PCRE) RegExes are supported. For anything remotely complex, enclose your RegEx in double-quotes. Then, for good measure put a backslash (\) in front of any double-quote (“) you require as a match character, and a backslash in front of any slash (/) match character, plus the usual rules.
Why am I seeing the same host graph twice? Answer: This is a bug I have personally discovered in Zabbix 6.0. It occurs when you have a template with just a single item and a single graph. They will be working on it as of August 2022.
In latest data I see: Value of type “string” is not suitable for value type “numeric unsigned.” Why? Answer: I got this in Zabbix 6.4 when I used zabbix_sender with argument -o 36 which I thought would feed in the integer 36. But no, it got interpreted as a string. I tried to introduce a preprcoessing step but I could not get it to work. In the end I created a dependent item with a RegEx to convert it. I made the original item type character. I could not beat this in a simple way.
I can’t get my new agent to be seen by its Zabbix proxy. Error is failed to accept an incoming connection: from [agent]: reading first byte from connection failed: [104] Connection reset. Answer: You may be running a Palo Alto firewall perhaps? They will permit the tcp handshake and then drop the connection with a “reset both sides.” which produces this error. Thus super simplified connection tests you run by hand with nc/nmp may appear to work.
Does changing the name of a host change its hostid? Answer: No. We have a multi-stage discovery process which relies on this fact.
Does the hosts IP filter accept a subnet mask? Answer: No, it is very primitive. It does accept a partial IP, strangely enough, so 10.9.9 matches 10.9.9.0/24.
A word about SSH checks and triggers
Through the school of hard knocks I have learned that my ssh check is clipping the output from the executed command. So you know that partial data you see when you look at latest data, and thought it was truncating it for display purposes? Nuh, ah. That’s all you’re getting to go up against in your trigger, which sucks. It’s something like 260 characters. I got lucky in a sense to discover this early by running an ssh check against dns resolution of amazon.com. The response I got varied almost every 60 seconds depending on whether or not the response came out of the dns cache. So this was an excellent testbed to learn about the flakiness of triggers as well as waste an entire day.
Another thing about triggers with a regex. As far as I can tell the logic is reversed. So you think you’re defining the OK condition when you seek to match the output and have it given the value of 1. But instead try to match the desired output for the OK condition, but assign it a value of 0. I guess. Only that approach seems to work for me. And getting the regex to treat multiple lines as a unit was also a little tricky. I think by default it favored testing only against the last line.
So let’s say my output as scraped from Monitoring|Latest Data alternated between either
proxy1>test dns amazon.com Performing DNS lookup for: amazon.com DNS Response data: Official Host Name: amazon.com Resolved Addresses: 205.251.242.103 176.32.98.166 176.32.103.205 Cache TTL: 1, cache HIT DNS Resolver Response: Success |
or
proxy1>test dns amazon.com Performing DNS lookup for: amazon.com Sending A query for amazon.com to 192.168.135.145. Sending A query for amazon.com to 8.8.8.8. DNS Response data: Official Host Name: amazon.com Resolved Addresses: 20 |
, then here is my iregexp expression which seems to do the correct thing (treat both of these outcomes as successes):
{proxy1:ssh.run[resolve DNS,1.2.3.4,22,utf-8].iregexp("(?s)((205\.251\.|176\.32\.)|Sending A query.+\s20)")}=0 |
Note that the (?s) at the beginning helps, I think, to treat the newline character as just another character which matches “.”. I may have an extra set of parentheses around the outermost alternating expression, but I can only experiment so much…
I ran various tests such as to change just one of the numbers to make sure it triggered.
I now think I will get better, i.e., more complete, results if I make the item of type text rather than character, at least that switch definitely helped with another truncated output I was getting from another ssh check. So, yes, now I am capturing all the output. So, note to self, use type text unless you have really brief output from your ssh check.
So with all that gained knowledge, my simplified expression now reads like this:
{proxy:ssh.run[resolve a dns name,1.2.3.4,22,utf-8].iregexp("(205\.251\.|176\.32\.)")}=0 |
Here’s a CPU trigger. From a show status it focuses on the line:
CPU utilization: 29%
and so if I want to trigger a problem for 95% or higher CPU, this expression works for me:
CPU utilization:\s+([ 1-8]\d|9[0-4])\% |
A nice online regular expression checker is https://regexr.com/
And a very simple PING test ssh check item, where the expected resulting line will be:
5 packets transmitted, 5 packets received, 0% packet loss
– for that I used the item wizard, altered what it came up with, and arrived at this:
(({proxy:ssh.run[ping 8.8.8.8,1.2.3.4,22,utf-8].iregexp("[45] packets received")})=0) |
So I will accept the results as OK as long as at most one of five packets was dropped.
A lesson learned from SNMP monitoring of F5 devices
My F5 BigIP devices began producing problems as soon as we set up the SNMP monitoring. Something like this:
Node /Common/drj-10_1_2_3 is not available in some capacity: blue (4) |
It never seemed to matter until now that my nodes appear blue. But perhaps SNMP is enforcing a best practice and expecting nodes to not be blue, meaning to be monitored. And it turns out you can set up a default monitor for your nodes (I use gateway_icmp). It’s found in Nodes | Default Monitor. I’m not sure why this is not better documented by F5. After this, many legacy nodes turn red so I am cleaning them up… But my conclusion is that I have learned something about my own systems from the act of implementing this monitoring, and that’s a good thing.
To be continued…
References and related
A good commercial solution for infrastructure monitoring: Microfocus SiteScope.
Direct link to Zabbix Repos (RPMs), including standalone RPMs for zabbix_sender, zabbix_get and zabbix_js: https://repo.zabbix.com/zabbix/5.0/rhel/8/x86_64/
A nice online regular expression (RegEx) checker is: https://RegEx101.com/.
Another online regular expression checker is: https://RegExr.com/.
Just to put it out there: If you like Zabbix you may also like Specto. Specto is an open-source tool for monitoring web sites (“synthetic” monitoring). I know one major organization which uses it so it can’t be too bad. https://specto.sourceforge.net/
Since this document is such a mess I’m starting to document some of my interesting items and Practical Zabbix examples in this newer and cleaner post. It includes the baseline calculation formula.
2 replies on “Monitoring by Zabbix: a working document”
STOP!! Where did you get that screenshot?
Configuration, Hosts… Scenarios? Web? What version are you on?
Mine is 5.2 and looks NOTHING like that. Is there different versions of 5.2? Can I downgrade to a different version so I can follow step-by-step guides to configuring? My zabbix is installed in a container in a hypervisor (crappy moxprox – not my choice!) it discovered all the devices and can get ICMP and SNMP info. The problem is zabbix. How do you put these on the map image? I have a satellite image map of this part of the country and I want to group devices by location and be able to have traffic light system on a location the click and drill down to next level to see what actual device has problem. Why can’t it be that easy to setup? The problem with zabbix is not the installation like most folk say… its the configuration. It is pants. There are too many different versions with different features and screens. Why oh why isnt there a simple step-by-step guide on setting it up (not installing – that’s done) so what to click first. What to add next, then next then next. Done. I can’t believe how fragmented and difficult the authors have made it. Look at Adrem software’s Netcrunch. Give it Ip ranges to discover. Drag and drop onto a map or nested map. Done. Why can’t zabbix do that? I’ll give it another day of trawling the net to find out how its done or it gets uninstalled.
I think my screenshots are mostly from v 4.4. And, hey, the more I use Zabbix the less I know about it. I agree with the spirit of your critique. I think there are so many ways to accomplish what you want that it becomes unclear what to do. I can’t remember what I’ve done day-to-day. Wish I could help, but I’m not very adept with it. I predict you will end up using another product since unlike me you have a choice.