Intro
I share some Zabbix items I’ve had to create which I find useful.
Low-level discovery to discover IPSEC tunnels on an F5 BigIP
IPSec tunnels are weird insofar as there is one IKE SA but potentially lots of SAs – two for each traffic selector. So if your traffic selector is called proxy-01, some OIDs you’ll see in your SNMP walk will be like …proxy-01.58769, …proxy-01.58770. So to review, do an snmpwalk on the F5 itself. That command is something like
snmpwalk -v3 -l authPriv -u proxyUser -a SHA -A shaAUTHpwd -x AES -X AESpwd -c public 127.0.0.1 SNMPv2-SMI::enterprises >/tmp/snmpwalk-ent
Now…how to translate this LLD? In my case I have a template since there are several F5s which need this. The template already has discovery rules for Pool discovery, Virtual server discovery, etc. So first thing we do is add a Tunnel discovery rule.
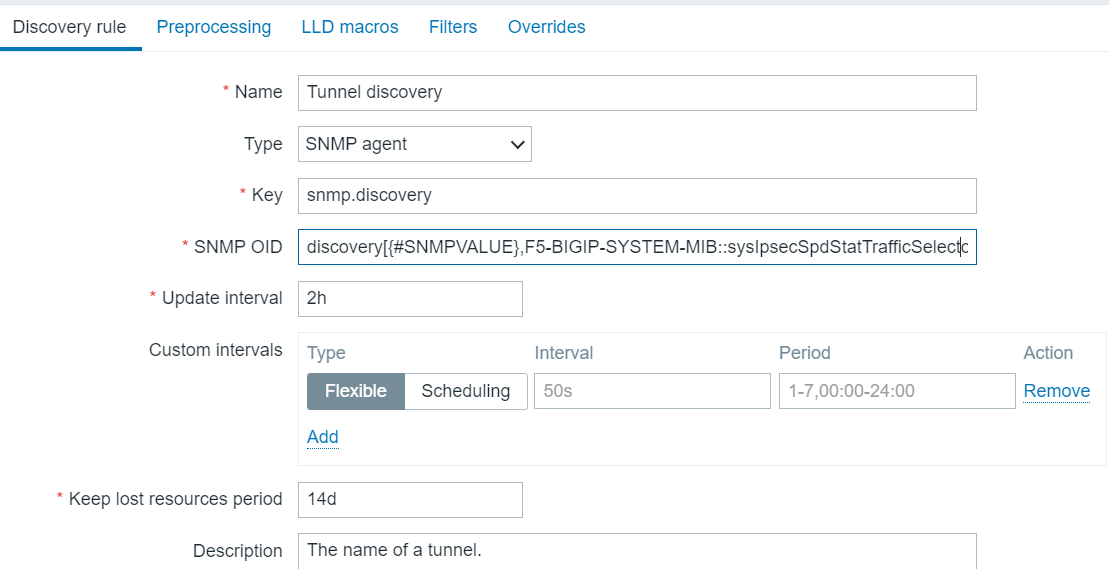
The SNMP OID is clipped at the end. In full it is:
discovery[{#SNMPVALUE},F5-BIGIP-SYSTEM-MIB::sysIpsecSpdStatTrafficSelectorName]
Initially I tried something else, but that did not go so well.
Now we want to know the tunnel status (up or down) and the amount of traffic over the tunnel. We create two item prototypes to get those.
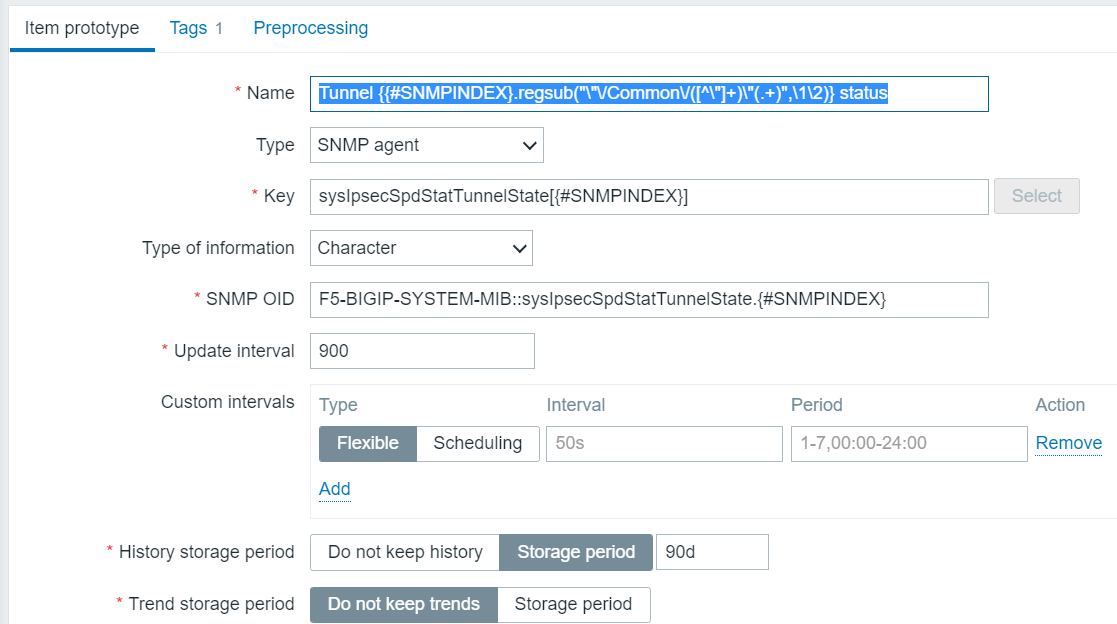
So, yes, we’re doing some fancy regex to simplify the otherwise ungainly name which would be generated, stripping out the useless stuff with a regsub function, which, by the way, is poorly documented. So that’s how we’re going to discover the statuses of the tunnels. In text, the name is:
Tunnel {{#SNMPINDEX}.regsub(“\”\/Common\/([^\”]+)\”(.+)”,\1\2)} status
and the OID is
F5-BIGIP-SYSTEM-MIB::sysIpsecSpdStatTunnelState.{#SNMPINDEX}
And for the traffic, we do this:
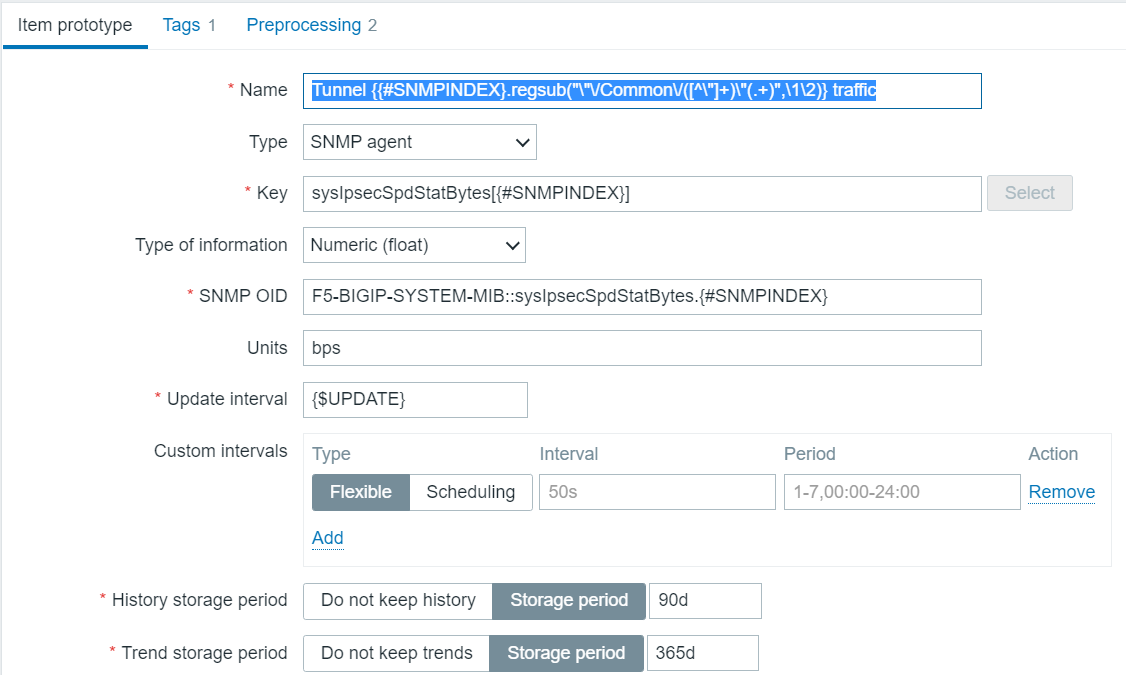
I learned how to choose the OID, which is the most critical part, I guess, from a combination of parsing the output of the snmpwalk plus imitation of those other LLD item prortypes, which were writtne by someone more competent than I.
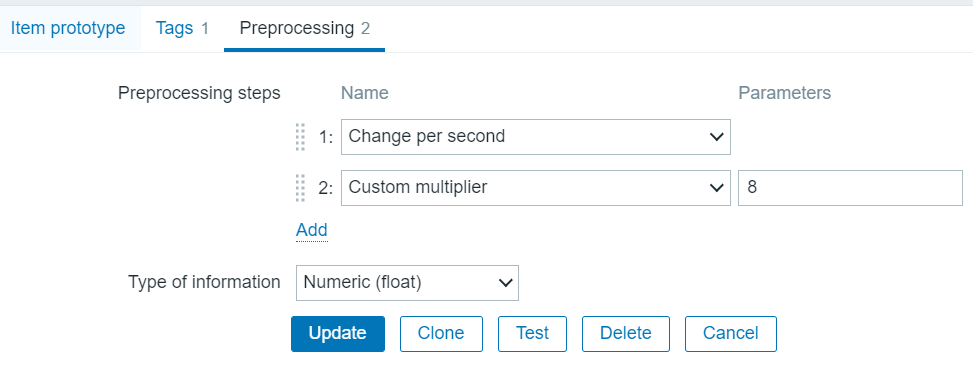
Now the SNMP value for traffic is bytes, but you see I set units of bps? I can do that because of the preprocessing steps which are
Final tip
For these discovery items what you want to do is to disable Create Enabled and disable Discover. I just run it on the F5s which actually have IPSEC tunnels. Execute now actually works and generates items pretty quickly.
Using the api with a token and security by obscurity
I am taking the approach of pulling the token out of a config file where it has been stored, base85 encoded, because, who uses base85, anyway? I call the following script encode.py:
import sys
from base64 import b85encode

s = sys.argv[1]
s_e = s.encode('utf-8')

s64 = b85encode(s_e)
print('s,s_e,s64',s,s_e,s64)
In my case I pull this encoded token from a config file, but to simplify, let’s say we got it from the command line. This is how that goes, and we use it to create the zapi object which can be used in any subsequent api calls. That is the key.
from base64 import b85decode
import sys

url_zabbix = sys.argv[1]
t_e = sys.argv[2] # base85 encoded token

# Login Zabbix API
t_b = t_e.encode('utf-8')
to_b = b85decode(t_b)

token_zabbix = to_b.decode('utf-8')
zapi = ZabbixAPI(url_zabbix)
zapi.login(api_token=token_zabbix)
...
So it’s a few extra lines of code, but the cool thing is that it works. This should be good for version 5.4 and 6.0. Note that if you installed both py-zabbix and pyzabbix, your best bet may be to uninstall both and reinstall just pyzabbix. At least that was my experience going from user/pass to token-based authentication.
Convert DateAndTime SNMP output to human-readable format
Of course this is not very Zabbix-specific, as long as you realize that Zabbix produces the outer skin of the function:
function (value) { |
// DrJ 2020-05-04 // see https://support.zabbix.com/browse/ZBXNEXT-3899 for SNMP DateAndTime format 'use strict'; //var str = "07 E4 05 04 0C 32 0F 00 2B 00 00"; var str = value; // alert("str: " + str); // read values are hex var y256 = str.slice(0,2); var y = str.slice(3,5); var m = str.slice(6,8); var d = str.slice(9,11); var h = str.slice(12,14); var min = str.slice(15,17); // convert to decimal var y256Base10 = +("0x" + y256); // convert to decimal var yBase10 = +("0x" + y); var Year = 256*y256Base10 + yBase10; // alert("Year: " + Year); var mBase10 = +("0x" + m); var dBase10 = +("0x" + d); var hBase10 = +("0x" + h); var minBase10 = +("0x" + min); var YR = String(Year); var MM = String(mBase10); var DD = String(dBase10); var HH = String(hBase10); var MIN = String(minBase10); // padding if (mBase10 < 10) MM = "0" + MM; if (dBase10 < 10) DD = "0" + DD; if (hBase10 < 10) HH = "0" + HH; if (minBase10 < 10) MIN = "0" + MIN; var Date = YR + "-" + MM + "-" + DD + " " + HH + ":" + MIN; return Date; |
I put that javascript into the preprocessing step of a dependent item, of course.
All my real-life examples do not fill in the last two fields: +/-, UTC offset. So in my case the times must be local times. But consequently I have no idea how a + or – would be represented in HEX! So I just ignored those last fields in the SNNMP DateAndTime which otherwise might have been useful.
Here’s an alternative version which calculates how long its been in hours since the last AV signature update.
// DrJ 2020-05-05 // see https://support.zabbix.com/browse/ZBXNEXT-3899 for SNMP DateAndTime format 'use strict'; //var str = "07 E4 05 04 0C 32 0F 00 2B 00 00"; var Start = new Date(); var str = value; // alert("str: " + str); // read values are hex var y256 = str.slice(0,2); var y = str.slice(3,5); var m = str.slice(6,8); var d = str.slice(9,11); var h = str.slice(12,14); var min = str.slice(15,17); // convert to decimal var y256Base10 = +("0x" + y256); // convert to decimal var yBase10 = +("0x" + y); var Year = 256*y256Base10 + yBase10; // alert("Year: " + Year); var mBase10 = +("0x" + m); var dBase10 = +("0x" + d); var hBase10 = +("0x" + h); var minBase10 = +("0x" + min); var YR = String(Year); var MM = String(mBase10); var DD = String(dBase10); var HH = String(hBase10); var MIN = String(minBase10); var Sigdate = new Date(Year, mBase10 - 1, dBase10,hBase10,minBase10); //difference in hours var difference = Math.trunc((Start - Sigdate)/1000/3600); return difference; |
Calculated bandwidth from an interface that only provides byte count
Again in this example the assumption is you have an item, probably from SNMP, that lists the total inbound/outbound byte count of a network interface – hopefully stored as a 64-bit number to avoid frequent rollovers. But the quantity that really excites you is bandwidth, such as megabits per second.
Use a calculated item as in this example for Bluecoat ProxySG:
change(sgProxyInBytesCount)*8/1000000/300 |
Give it type numeric, Units of mbps. sgProxyInBytesCount is the key for an SNMP monitor that uses OID
IF-MIB::ifHCInOctets.{$INTERFACE_TO_MEASURE} |
where {$INTERFACE_TO_MEASURE} is a macro set for each proxy with the SNMP-reported interface number that we want to pull the statistics for.
The 300 in the denominator of the calculated item is required for me because my item is run every five minutes.
Alternative
No one really cares about the actual total value of byte count, right? So just re-purpose the In Bytes Count item a bit as follows:
- add preprocessing step: Change per second
- add second preprocessing step, Custom multiplier 8e-6
The first step gives you units of bytes/second which is less interesting than mbps, which is given by the second step. So the final units are mbps.
Be sure to put the units as !mbps into the Zabbix item, or else you may wind up with funny things like Kmbps in your graphs!
Creating a baseline
Even as of Zabbix v 5, there is no built-in baseline item type, which kind of sucks. Baseline can mean many different things to many people – it really depends on the data. In the corporate world, where I’m looking at bandwidth, my data has these distinct characteristics:
- varies by hour-of-day, e.g., mornings see heavier usage than afternoons
- there is the “Friday effect” where somewhat less usage is seen on Fridays, and extremely less usage occurs on weekends, hence variability by day-of-week
- probably varies by day of month, e.g., month-end closings
So for this type of data (except the last criterion) I have created an appropriate baseline. Note I would do something different if I were graphing something like the solar generation from my solar panels, where the day-of-week variability does not exist.
Getting to the point, I have created a rolling lookback item. This needs to be created as a Zabbix Item of type Calculated. The formula is as follows:
(last(sgProxyInBytesCount,#1,1w)+
last(sgProxyInBytesCount,#1,2w)+
last(sgProxyInBytesCount,#1,3w)+
last(sgProxyInBytesCount,#1,4w)+
last(sgProxyInBytesCount,#1,5w)+
last(sgProxyInBytesCount,#1,6w))/6
In this example sgProxyInBytesCount is my key from the reference item. Breaking it down, it does a rolling lookback of the last six measurements taken at this time of day on this day of the week over the last six weeks and averages them. Voila, baseline! The more weeks you include the more likely you are to include data you’d rather not like holidays, days when things were busted, etc. I’d like to have a baseline that is from a fixed time, like “all of last year.” I have no idea how. I actually don’t think it’s possible.
But, anyway, the baseline approach above should generally work for any numeric item.
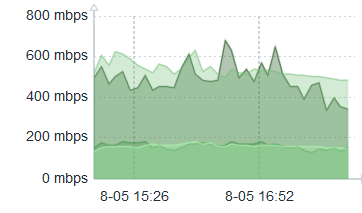
Refinement
The above approach only gives you six measurements, hence 1/sqrt(6) ~ 40% standard deviation by the law of large numbers, which is still pretty jittery as it turns out. So I came up with this refined approach which includes 72 measurements, hence 1/sqrt(72) ~ 12% st dev. I find that to be closer to what you intuitively expect in a baseline – a smooth approximation of the past. Here is the refined function:
(avg(sgProxyInBytesCount,1h,1w)+
avg(sgProxyInBytesCount,1h,2w)+
avg(sgProxyInBytesCount,1h,3w)+
avg(sgProxyInBytesCount,1h,4w)+
avg(sgProxyInBytesCount,1h,5w)+
avg(sgProxyInBytesCount,1h,6w))/6
I would have preferred a one-hour interval centered around one week ago, etc., e.g., something like 1w+30m, but such date arithmetic does not seem possible in Zabbix functions. And, yeah, I could put 84600s (i.e., 86400 – 1800), but that is much less meaingful and so harder to maintain. Here is a three-hour graph whose first half still reflects the original (jittery) baseline, and last half the refined function.
What I do not have mastered is whether we can easily use a proper smoothing function. It does not seem to be a built-in offering of Zabbix. Perhaps it could be faked by a combination of pre-processing and Javascript? I simply don’t know, and it’s more than I wish to tackle for the moment.
Data gap between mulitple item measurements looks terrible in Dashboard graph – solution
In a Dashboard if you are graphing items which were not all measured at the same time, the results can be frustrating. For instance, an item and its baseline as calculated above. The central part of the graph will look fine, but at either end giant sections will be missing when the timescale of display is 30 minutes or 60 minutes for items measured every five minutes or so. Here’s an example before I got it totally fixed.
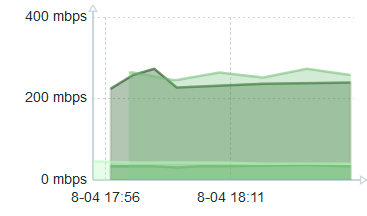
See the left side – how it’s broken up? I had beguin my fix so the right side is OK.
The data gap solution
Use Scheduling Intervals in defining the items. Say you want a measurement every five minutes. Then make your scheduling interval m/5 in all the items you are putting on the same graph. For good measure, make the regular interval value infrequent. I use a macro {$UPDATE_LONG}. What this does is force Zabbix to measure all the items at the same time, in this case every five minutes on minutes divisible by five. Once I did that my incoming bandwith item and its corresponding baseline item aligned nicely.
Low-level Discovery
I cottoned on to the utility of this part of Zabbix a little late. Hey, slow learner, but I eventually got there. What I found in my F5 devices is that using SNMP to monitor the /var filesystem was a snap: it was always device 32 (final OID digit). But /var/log monitoring? Not so much. Every device seemed different, with no obvious pattern. Active and standby units – identical hardware – and some would be 53, the partner 55. Then I rebooted a device and its number changed! So, clearly, dynamically assigned and no way was I going to keep up with it. I had learned the numbers by doing an snmpwalk. The solution to this dynamically changing OID number is to use low-level discovery.
Tip: using zabbix_sender in a more robust fashion
We run the Zabbix proxies as pairs. They are not run as a cluster. Instead one is active and the other is a warm standby. Then we can upgrade at our leisure the standby proxy, switch the hosts to it, then upgrade the other now-unused proxy.
But our scripts which send results using zabbix_sender run on other servers. Their data stops being recorded when the switch is made. What to do?
I learned you can send to both Zabbix proxies. It will fail on the standby one and succeed on the other. Since one proxy is always active, it will always succeed in sending its data!
A nice DNS synthetic monitor
It would have been so easy for Zabbix to have built in the capability of doing synthetic DNS checks against your DNS servers. But, alas, they left it out. Which leaves it to us to fill that gap. Here is a nice and simple but surprisingly effective script for doing synthetic DNS checks. You put it in the external script directory of whatever proxy is monitoring your DNS host. I called it dns.sh.
#!/bin/sh
# arg1 - hostname of nameserver
# arg2 - DNS server to test
# arg3 - FQDN
# arg4 - RR type
# arg5 - match arg
# [arg6] - tcpflag # this argument is optional

# if you set DEBUG=1, and debug through zabbix, set item type to text
DEBUG=0
timeout=2 # secs - seems a good value
name=$1
nameserver=$2
record=$3
type=$4
match=$5
tcpflag=$6
[[ "$DEBUG" -eq "1" ]] && echo "name: $name, nameserver: $nameserver , record: $record , type: $type , match pattern: $match, tcpflag: $tcpflag"
[[ "$tcpflag" = "y" ]] || [[ "$tcpflag" = "Y" ]] && PROTO="+tcp"
# unless you set tries to 1 it will try three times by default!
MATCH=$(dig +short $PROTO +timeout=$timeout +tries=1 $type $record @${nameserver} )
[[ "$DEBUG" -eq "1" ]] && echo MATCHed line is $MATCH
return=0
[[ "$MATCH" =~ $match ]] && return=1
[[ "$DEBUG" -eq "1" ]] && echo return $return
echo $return
It gives a value of 1 if it matched the match expression, 0 otherwise.
Conclusion
A couple of really useful but poorly documented items are shared. Perhaps more will be added in the future.
References and related
https://support.zabbix.com/browse/ZBXNEXT-3899 for SNMP DateAndTime format
My first Zabbix post was mostly documentation of a series of disasters and unfinished business.
Blog post about calculated items by a true expert: https://blog.zabbix.com/zabbix-monitoring-with-calculated-items-explained/9950/
Low-level Discovery write-up: https://blog.zabbix.com/how-to-use-zabbix-low-level-discovery/9993/
One reply on “Practical Zabbix examples”
Hi, I created the discovery rules with the items you provided. getting this error snmp_parse_oid(): cannot parse OID “F5-BIGIP-SYSTEM-MIB::sysIpsecSpdStatTrafficSelectorName”.