This is an active investigation and I cannot stamp case closed at the end as is my wont!
I have access to both source and destination servers. They are virtualy DNS servers running linux and BIND. pretty standard stuff.
We had been measuring response times of DNS queries and were all too often getting high values – like 3000 ms high! But not always. Also 50 ms.
And there were these ICMP messages to this effect:
ICMP 10.13.24.21 udp port 51343 unreachable, length 233
Fortunately I had the ability to do a packet tarce at both source and destination servers – that is a rare luxury these days in the age of granular access control.
Well, what I was seeing was the source DNS server sending a simple UDP query to the destination DNS server, just one UDP packet while the destination server saw that same packet four times! But not always. Slometimes it only saw one packet. Sometimes two packets. So it is random but occurring so often a trace for a few seconds shows the problem.
This is an actual dream, or more like a nightamre, that I had recently. I guess it’s illustrative of an IT person’s worst fears.
The dream
Well I don’t remember dreams very well and I’m not the kind ot embellish stories to make them sound more interesting so this is going to be brief.
So in this dream I am at the office. My work situation seems to be that I have slightly more access than I need to various systems. The workpllace is a lagre corporate office where processes are followed but still individual contributors want to make a difference so there is some self-imposed pressure to do something of value.
So anyway I find myself in this dream needing to make a configuration change to a monitoring system. Something like a Zabbix implementation. Now I know that I am not chiefly responsible for it, and in fact I should not be modifying it, but I have some idea that what I plan to do will make it better in some way. It’s in fairly widespread usage – about 150 users.
While doing this improvement it asks me for a new administrator password. But it wasn’t exactly that. It changed the administrator password, displayed the new one, and suggested I copy it and save it, which I did. This dialog only displayed for about 10 seconds and that screen went away.
Actually I hadn’t quite had time to save that new admin password, I just had it in my clipboard. I went to notepad++ to paste it and preserve it. There was nothing in my clipboard! That deep, sinking feeling set in. Even if it continues to work, we won’t be able to do patches so it is as good as killed, it will just take a little longer.
I guess we’ve all been there, right?
Inspired by
IRL I was purchasing tickets for Shen Yun. I selected seats and was at the part where you enter credit card info. My Edge browser proposed to enter a generated credit card number, which I generally approve of as an anti-fraud measure, so I let it fill in the info. It needed biometric authentication – face. The next thing I knew the whole browser screen vanished. Edge running on a completely patched Windows 11 PC simply crashed without a word. I think it bears mentioning because unlike the bad old days where crashes were customary, these days it’s not such a quotidien occurence. And when I restarted things, there was no memory of my seat selection but they were blocked from being purchaseable. Kind of a worst case scenario there. I didn’t wish to wait for the 20 minute purchase timer to timeout as few seats were available. Fortunately there were comparable seats in another row. Second time through it did not propose to fill in with a random card and things went through.
A colleague of mine in another timezone created the necessary DKIM records in Cloudflare for a new mail domain. There was panic as the mail team realized too late these records were not validating. I was called in to help. Unfortunately at the beginning I only my smartphone to work with. Did you ever try to do this kind of detail work with a smartphone? Don’t.
The details
The smartphone thing is worthy of a separate post. I was getting somewhere, but it is like working with both hands tied behind yuor back.
So the mail team is telling me the dkim record doesn’t validate and showing me a screenshot of something from mxtoolbox to prove it.
I of course want to know the details so I can verify my mistakes before anyone else gets to – that’s how I roll!
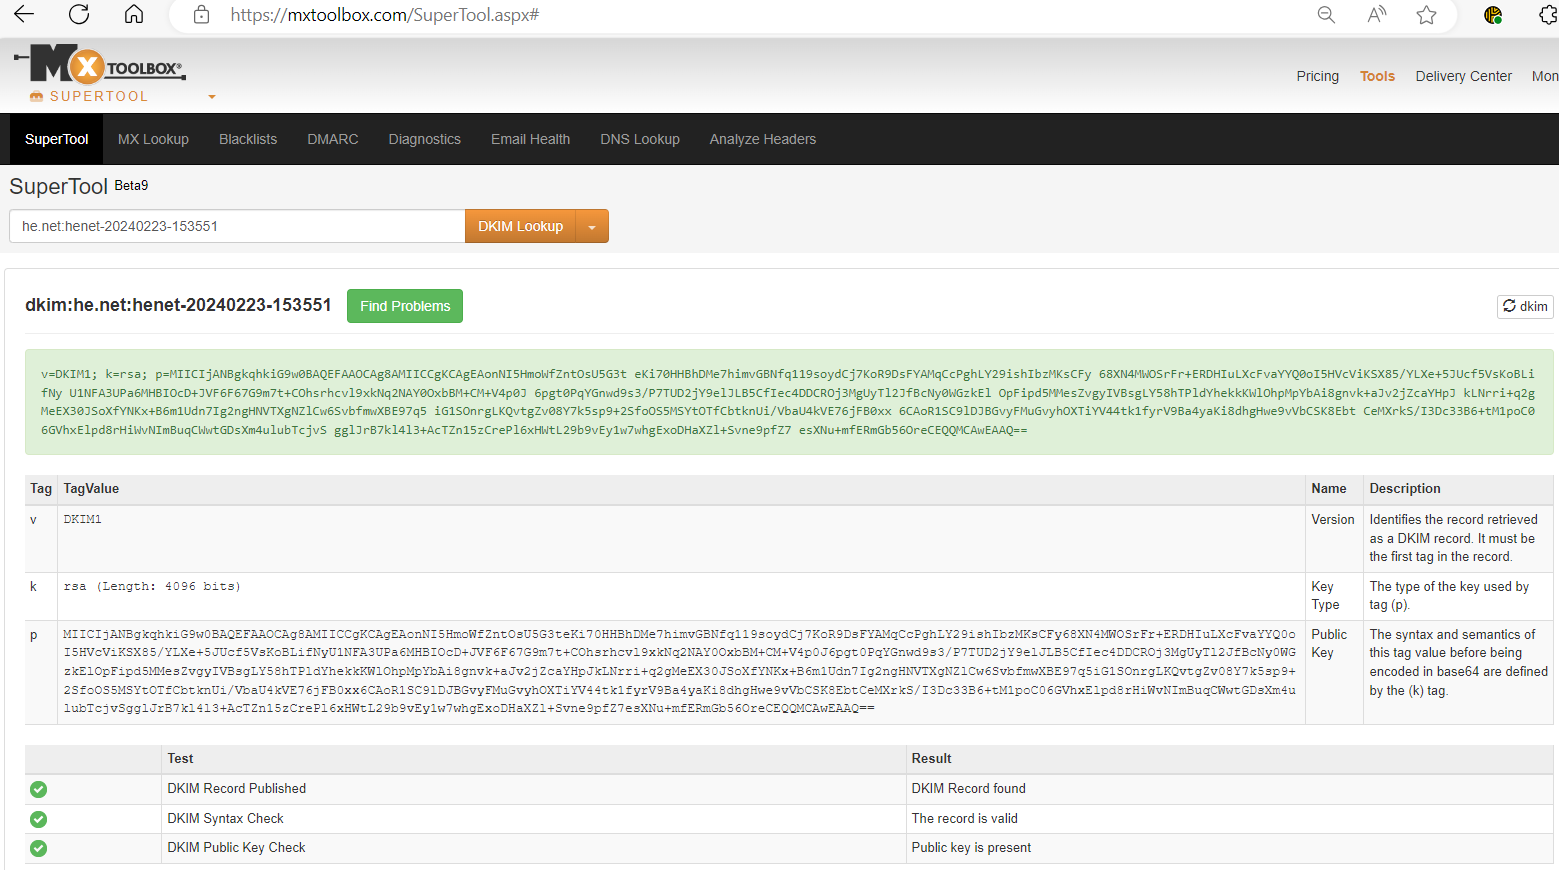
Well, mxtoolbox, has a free validator for these dkim records which is pretty useful. Go to Supertool, then click the dropdown and select DKIM. A DKIM record involves a domain and a selector. Here’s a real live example for Hurricane Electric which uses he.net as their sending mail domain. So in their DNS the DKIM txt record for them looks like this when viewed from dig:
This is the value for this record: henet-20240223-153551._domainkey.he.net
To validate this DKIM record in mxtoolbox we pull out the token in front of _domainkey and refer to it as the selector, and drop the _domainkey and enter it like this:
The problem with the DKIM entry I was assigned to rescue was that the DIM syntax check was not passing. Yet it looked just like the way the mail team requested. What is going on? How can this problem be broken down into smaller steps???
To be continued…
Appendix A
How did I know the exact selector for Hurricane Electric?
I looked at the SMTP headers of an email I received from them. I found this section:
d must stand for domain and s for selector. This is all considered public information, albeit somewhat obscure. So the domain is he.net and the selector is henet-20240223-153551.
It’s convenient to name drop different types of cyber attacks at a party. I often struggle to name more than a few. I will try to maintain a running list of them.
But I find you cannot speak about cybersecurity unless you also have a basic understanding of information technology so I am including some of those terms as well.
As I write this I am painfully aware that you could simply ask ChatGPT to generate a list of all relevant terms in cybersecurity along with their definitions – at least I think you could – and come up with a much better and more complete list. But I refuse to go that route. These are terms I have personally come across so they have special significance for me personally. In other words, this list has been organically grown. For instance I plowed through a report by a major vendor specializing in reviewing other vendor’s offerings and it’s just incredible just how dense with jargon and acronyms each paragragh is: a mother lode of state-of-the-art tech jargon.
Terms from history
I’ve thrown in some terms from my personal history having spent decades in the field, terms I’m pretty sure you won’t find in anyone else’s standard dictionary, like, let’s say xmosaic.
AiTM (Adversary in the Middle)
Bad Likert Judge
A technique for jailbreaking LLMs.
Baitortion
I guess an attack which has a bait such as a plum job offer combined with some kind of extortion? The usage was not 100% clear.
bootkit
BYOVD (Bring Your Own Vulnerable Driver)
Clickfix infection chain
Upon visiting compromised websites, victims are redirected to domains hosting fake popup windows that instruct them to paste a script into a PowerShell terminal to fix an issue.
Collision attack
I.e., against the MD5 hash algorithm as done in the Blast RADIUS exploit.
Credential Harvesting
Credential Stuffing Attack
I.e., password re-use. Takes advantage of users re-using passwords for different applications. Nearly three of four consumers re-use password this way. Source: F5. Date: 3/2024
CSRF (Cross-Site Request Forgery)
Unauthorized commands are submitted from a user that the web application trusts. Also XSRF.
Data Wiper
Authentication Bypass
See for instance CVE-2024-0012
Email bombing
A threat actor might flood a victom with spam then offer “assistance” to fix it.
Evasion
Malicious software built to avoid detection by standard security tools.
Password spraying
A type of attack in which the threat actor tries the same password with multiple accounts, until one combination works.
Port Scan
Self-describing.
ProxyLogon
Affected MS Exchange and exploited by Silk Typhoon.
XSRF (Cross-site Request Forgery)
See CSRF.
Host Sweep
Supply Chain attack
Social Engineering
Hacking
Hacktivist
I suppose that would be an activitst who uses hacking to further their agenda.
Hex Staging
No idea. Insufficient context in the place where I read the term.
Jailbreaking
A form of privilege escalation. Removing limitations of an OS like Android or iOS.
Living off the land
Network reconnaissance
Data Breach
Keylogger
Darknet
Captcha
Click farms
DLL hijacking
Jackpotting
This is one of my favorite terms. Imagine crooks implanted malware into an ATM and were able to convince it to dispense all its available cash to them on the spot! something like this actually happened. Scary.
Overlay Attack
Example: When you open a banking app on your phone, malware loads an HTML phishing page that’s designed to look just like that particular app and the malware’s page is overlaid on top.
Payment fraud attack
In a recent example, the victim experienced “multiple fraudulently induced outbound wire transfers to accounts controlled by unknown third parties.”
PlugX
A type of malware.
Skimmer
XSS (Cross site Scripting)
bot
Anti-bot, bot defense
Mitigation
Selenium (Se) or headless browser
Obfuscation
PII, Personally Identifiable Information
api service
Reverse proxy
Inline
endpoint, e.g., login, checkout
scraping
Layer 7
DDOS
Carpet bombing DDOS attack
Many sources hitting many targets within the same subnet. See:
A social engineering attack where scammers target grandparents by pretending to be a grandchild in a bind.
GUI
(JavaScript) Injection
Command Injection
Hotfix
SDK
Method
TLS
Clear text
X-Forwarded-For
Client/server
Threat Intelligence
Prompt Injection
A malicious prompt given to an AI model.
XPIA (Cross-Prompt Injection Attack)
Indirect Prompt Injection
LLM scope violation
New term as of June 2025.
Carding attack
Source code
CEO Fraud
Phishing
TOCTOU (Time-of-Check Time-of-Use)
Vulnerability in VMWare ESX.
Vishing
(Voice Phishing) A form of cyber-attack where scammers use phone calls to trick individuals into revealing sensitive information or performing certain actions.
Business email compromise (BEC)
VEC (Vendor Email Compromise)
Deepfake
Threat Intelligence
Social engineering
Cybercriminal
SIM box
Command and control (C2)
Typo squatting
Voice squatting
A technique similar to typo squatting, where Alexa and Google Home devices can be tricked into opening attacker-owned apps instead of legitimate ones.
North-South
East-West
Exfiltrate
Malware
Infostealer
Obfuscation
Antivirus
Payload
Sandbox
Control flow obfuscation
Buffer overflow
Use after free
Indicators of Compromise
AMSI (Windows Antimalware Scan Interface)
Polymorphic behavior
WebDAV
Protocol handler
Firewall
Zero Trust
Zero Trust is a security model that assumes that all users, devices, and applications are inherently untrustworthy and must be verified before being granted access to any resources or data.
Zero Trust Network Access (ZTNA)
ZTA (Zero Trust Architecture)
Zero Trust Edge (ZTE)
Secure Web Gateway (SWG)
Cloud Access Security Broker (CASB)
Remote Browser Isolation (RBI)
Content Disarm and Reconstruction (CDR)
Firewall as a service
Egress address
Data residency
Data Loss Prevention (DLP)
Magic Quadrant
Managed Service Provider (MSP)
0-day or Zero day
User Experience (UX)
Watermark
DevOps
Multitenant
MSSP
Remote Access Trojan (RAT)
SOGU
2024. A remote access trojan.
Object Linking and Embedding
(Powershell) dropper
Backdoor
Data Bouncing
A technique for data exfiltration that uses external, trusted web hosts to carry out DNS resolution for you
Infostealer
Shoulder surfing
Ransomware
Pig butchering
This is particularly disturbing to me because there is a human element, a foreign component, crypto currency, probably a type of slave trade, etc. See the Bloomberg Businessweek story about this.
Server site attack that leads to sensitive information disclosure from the back-end server of the application
Attack vector
Economic espionage
Gap analysis
AAL (Authentication Assurance Level)
IAL (Identity Assurance Level)
CSPM (Cloud Security Posture Management)
Trust level
Network perimeter
DMZ (Demilitarized zone)
Identity Farming
Sites set up to encourage unsuspecting victims to voluntarily hand over their identity documents and facial images in return for financial compensation.
Defense in depth
Lateral movement
Magecart
Malicious code is injected into a website to steal sensitive information, such as credit card details, from users filling out forms.
Access policy
Micro segmentation
Least privilege
Privilege Escalation (PE)
Breach
Intrusion
Insider threat
Cache poisoning
I know it as DNS cache poisoning. If an attacker manages to fill the DNS resolver’s cache with records that have been altered or “poisoned.”
Teardrop attack
A teardrop attack exploits how systems reassemble fragmented data packets during transmission by sending overlapping fragments that the target system cannot properly reconstruct, leading to a denial of service.
A text-based interfaces that allow for remote server control.
Crypto Miner
RCE (Remote Code Execution)
Threat Actor
APT (Advanced Persistent Threat)
Compromise
Vulnerability
Bug
Worm
Remote Access VPN (RAVPN)
XDR (Extended Detection and Response)
SIEM (Security Information and Event Management)
User Entity Behavior Analytics (UEBA)
Path traversal vulnerability
An attacker can leverage path traversal sequences like “../” within a request to a vulnerable endpoint which ultimately allows access to sensitive files like /etc/shadow.
Tombstoning
Post-exploit persistence technique
Volumetric DDoS
MFA bomb
Bombard a user with notifications until they finally accept one.
Use-after-free (UAF)
A use-after-freevulnerability occurs when programmers do not manage dynamic memory allocation and deallocation properly in their programs.
Cold boot attack
A cold boot attack focuses on RAM and the fact that it is readable for a short while after a power cycle.
Formed in 2023 and known for its sophisticated cyber warfare attacks and successful hacks of high-security systems. Has a pro-Palestinian bent.
Scattered Spider
A financially motivated threat group, responsible for the 2025 Marks and Spencer breech.
Silk Typhoon
A Chinese-based group focused on espionage, now targeting common IT solutions to gain initial access, and then compromise these companies’ downstream customer environments.
Volt Typhoon
2024. A China-nexus threat actor
Cybersecurity Terminology
What makes a term a cybersecurity term versus an It term? I had to think about it a bit. There is a lot of overlap for sure. Today to be in IT is to be mindful of security every working moment of your day. So I ended up with just a few terms which I threw into this bucket of cybersecurity terminology. It was my judgment call.
360
360 Security Group is a respected vendor in the threat intelligence arena.
A loose way of talking about the variety of infrastructrure owned by an entity which is exposed to hacking.
ASM (Attack surface Management)
A testing and tracking tool a cyber security center might use.
AsyncRAT
A type of Remote Access Trojan
Blast Radius
One of those annoying terms borrowed from the military that only marketing people like to throw around. It means what you think it might mean.
Blue Team – see Red Team
BSI (The German Federal Office for Information Security)
Cisco Talos
A cybersecurity technology and information security company that conducts threat research, vulnerability disclosure, and incident response for Cisco and its customers
CNI (Critical National Infrastructure)
CNNVD (China National Vulnerability Database of Information Security)
CNVD (China National Vulnerability Database)
China’s EUVD.
CTI (Cyber Threat Intelligence)
Checkpoint likes this term.
Cryptomining
CSAM
The process of identifying, categorizing, tracking, and managing information technology (IT) assets to ensure their integrity, confidentiality, and availability
CSP (Content Security Policy)
DDosia
A cross-platform program that conducts DDoS attacks with a pro-Russia bent against websites in Europe and other regions
DLP (Data Loss Prevention)
DLS (Data Leak Sites)
Sites where you can see who has had their data stolen.
Dwell Time
Time spent by a hacker in your network.
EUVD (European Vulnerability Database)
The EU answer to Mitre’s CVE. Serves as a centralized repository for cybersecurity vulnerabilities affecting ICT products and services across the EU and aims to provide a trusted resource for both public and private sectors.
Feroxbuster
Kali Linux tool designed to perform Forced Browsing. Forced browsing is an attack where the aim is to enumerate and access resources that are not referenced by the web application.
Hacktivism
Hacking done by activitsts.
HMI (Human Machnie Interface)
Comes up in the context of water systems.
Initial Access Broker
The agent who got access to a network and may hand it off to others.
The free scanner component of Greenborne Vulnerability Management.
Passkey
Modern authentication method designed to replace traditional passwords with a more secure and user-friendly alternative which is usually biometric-based.
Patch Tuesday
Microsoft releases patches for all their bugs on the first or second Tuesday of each month.
Pen Test (Penetration Test)
Red Team
In a red team/blue team exercise, the red team is made up of offensive security experts who try to attack an organization’s cybersecurity defenses.
Red Wolf
Company which offers A DDOS testing service.
Shodan
A search engine that allows users to find various types of devices connected to the internet, such as webcams, routers, and servers, plus what software versions are running.
TI (Threat Intelligence)
TOR (The Onion Router)
A series of network nodes which provide anonymity to its users. Mainly used for nefarious pruposes.
TTP (Tactics, Techniques and Procedures)
Virustotal
Portal used to check if a web site has vulnerabilities checking multiple sources.
WAF (Web Application Firewall)
Whitehat
The good guys.
IT terminology
I’ve chosen the terms I personally come across. I find most IT concepts not particularly difficult to understand, but they are usually coded in a firehose of shorthand references. So a reference is helpful. Thus I’ve also decided to include some terms specific to some of the more popular vendors – because you hear others talking about them using their terminology and shorthand references, and you want to know what they are saying. Some of the definitions are meant to be humorous, like Johnson’s dictionary.
2FA (2 Factor Authentication)
3G (3rd Generation)
Refers to the third generation of telecom technologies.
3PL (3rd Party Logistics)
802.1x
A (Address record)
Base DNS record type which turns a domain name into an IP address
AAAA
A DNS address record which resolves to an ipv6 address.
ACL (Access Control List)
AD (Active Directory)
ADO (Azure DevOps)
AFK (Away From Keyboard)
Agentic AI
Autonomous agents power by AI. Term becoming popular in 2025.
AGI (Artificial General Intelligence)
AGI is the theory and development of computer systems that can act rationally.
AIOps
Applying AI to IT operations.
AIP (Azure Information Protection)
This is the old name as of March 2025. See MPIP for the new name.
AIX
A Unix variant supported by IBM. It had really strange conventions.
ALPN (Application Layer Protocol Negotiation)
A TLS extension used to establish HTTP/2 connections without additional round trips.
AMI (Amazon Machine Image)
AMS (Access Management Systems)
Physical building access through authentication methods like passwords, biometrics, and multi-factor authentication.
Anaconda
A python development platform.
ANN (Artificial Neural Network)
Ansible
I would call it an open source orchestrator.
anti-aliasing
When you smooth out color in neighboring pixels.
anycast
Anydesk
A popular remote management software.
AP (Access Point)
apache
A formerly popular open source web server which became bloated with features.
APM (Application Performance Management)
ARD (Apple Remote Desktop)
ARIN (American Registry for Internet Numbers)
They dole out blocks of IPv4 and IPv6 public address space.
ARM
A processor architecture from ARM Corporation, as opposed to, e.g., x86. Raspberry Pis use ARM. I think Androids do as well.
ARN (Amazon Resource Name)
An S3 bucket will have an ARN identifier consisting of six labels.
ARP (Address Resolution Protocol)
ASCII
An early attempt at representing alpha-numeric characters in binary. Was very english-focussed.
ASN (Autonomous System Number)
Each AS is assigned an autonomous system number, for use in Border Gateway Protocol routing
ASN.1 (Abstract Syntax Notation One)
A standard interface description language (IDL) for defining data structures that can be serialized and deserialized in a cross-platform way.
ASPA (Autonomous System Provider Authorization)
An add-on to RPKI that allows an ASN to create a record that lists which ASNs can be providers for that ASN. The concepts are “customer” (an ASN) and “providers” (a list of ASNs). This is used to do hop by hop checking of AS paths.
ASR (Aggregation Services Router)
A high-end Interent router offered by Cisco for business customers.
Assembly
The raw instructions for a microprocessor to follow which results from compiling a program.
asuid (Application Service Unique Identifier, according to chatgpt)
Token sometimes found at the beginning of a dns FQDN.
AT (Authenticated Transfer [Protocol])
A protocol supporting social networking. Used by Bluesky.
At scale
A scaled-up deployment.
AutoIt
Scripting language designed for automating the Windows GUI (Graphical User Interface) and general scripting tasks. It allows users to create scripts that can simulate keystrokes, mouse movements, and manipulate windows and processes.
AV (anti-virus)
AWS (Amazon Web Services)
AZ (Azure)
Azure AD
Azure Local
Often referred to in the context of Azure Stack, is a set of products and services from Microsoft that allows organizations to run Azure services in their own data centers or on edge devices
B2B (Business-to-Business)
As opposed to B2C.
B2C (Business-to-Consumer)
Beacon
System which broadcasts keep alive data regularly, I think.
BeQ (not sure about this one yet)
BGP (Border Gateway Protocol)
BIND (Berkeley Internet Name Daemon)
An open source implementation of DNS, found on many flavors of linux.
BIOS (Basic Input/Output System)
BITNET
An early (pre-Internet) network for High Energy Physics which connected some universities in the US with some in Europe. I used to use it.
blob (Binary Large OBject)
Binary file
BOM (Bill of Material)
Boot start
A flag for a driver in Windows that tells it to always start on boot.
bootp
A predecessor protocol to DHCP.
broadcast
Browser
BYOD (Bring Your Own Device)
I.e., when employees are permitted to use their personal smartphone to conduct company business.
BYOL (Bring Your Own License)
F5 permits this approach to licensing one of their cloud appliances.
CA (Certificate Authority)
CAA (Certificate Authority Authorization)
DNS record that allows domain owners to specify which certificate authorities (CAs) are permitted to issue SSL/TLS certificates for a domain.
A type of DNS record.
CAB (Change Advisory Board)
May not be a universal term.
Callback
A routine designed to be called when someone else’s code is executing. At least that’s how I understand it.
CAPWAP (Control and Provisioning of Wireless Access Points)
A Cisco protocol where the WLCs control the APs.
CCNA (Cisco Certified Network Associate)
An entry-level IT certification covering Cisco products.
CDL (Cortex Data Lake)
Another Palo Alto Networks term.
CDR (Call Detail Record)
Metadata for a phone call.
CDN (Content Distribution Network)
CDP (Cisco Discovery Protocol)
This protocol allows devices connected to switch ports to learn what switch and which switch port they are connected to. It is a layer 2 protocol.
CDR (Cloud Detection and Response)
CDSS (Cloud Delivered Security Services)
Only used in Palo Alto Networks land.
CE (Customer Edge or Customer Equipment)
CGN or CGNAT (Carrier Grade NAT)
The address space 100.64.0.0/10 is handled specially by ISPs for CGN. RFC 6598
CHAP
Chatbot
A computer program that simulates human conversation with and end user.
Checksum
An XOR operation on binary data which creates a short and unique signature. Different algorithms may be used.
Chrome
An OS from Google based on linux and somewhat more inflexible and less buggy than Windows.
Chromebook
A laptop which runs CHROME OS.
Chromium
I think this is the open source(?) foundation for some browsers such as Edge.
CI (Configuration Item)
An ITIL term referring to the object upon which changes are made.
CISA (Cybersecurity and Infrastructure Security Agency)
CISC (Complex Instruction Set Architecture)
CISO (Chief Information Security Officer)
CISSP (Certified Information Systems Security Professional)
Cleartext
Format where no encryption has been applied.
CLI (Command Line Interface)
Client Server
Was all the rage 20 years ago.
CMDB (Configuration Management Database)
CMO (Current Mode of Operations)
CNAME (Canonical NAME)
DNS record which associates a name with another name.
CNN (Congruential Neural Network)
CO (Central Office)
Old telecom lingo.
Codec (Compressor-Decompressor)
A technology or software that encodes and decodes digital data streams or signals
Computer Vision
A field of AI that leverages machine learning and neutral networks to enable machines to identify and understand visual information such as images and videos.
Copilot
Microsoft’s AI built into their productivity software. Sorry, no more Clippy.
Courrier
A well-known fixed-width font.
CPE (Customer Premise Equipment)
CPU (Central Processing Unit)
CRL (Certificate Revocation List)
A primitive predecessor to OCSP.
CRM (Customer Resource Management)
Software delivered by, e.g., Salesforce.
CRUD (Create, Read, Update, and Delete)
Four basic operations used in managing data in databases and applications.
CSAM (Customer Success Account Manager)
CSPM (Cloud Security Posture Management)
CSR (Certificate Signing Request)
CSSA (Cyber Security Sharing and Analytics alliance)
CSV (Comma-Separated Values)
A simplified exchange format for spreadsheet data.
CUDA (Compute Unified Device Architecture)
A programming language (by Nvidia?) that lets developers write applications for GPUs.
CUPS (Common Unix Printing Systems)
curl
A simple browser for the command line.
Cursor
The underline thingy which shows where your typed text will be entered into a document or form.
CVE
CVEs, or Common Vulnerabilities and Exposures, are a maintained list of vulnerabilities and exploits in computer systems. These exploits can affect anything, from phones to PCs to servers or software. Once a vulnerability is made public, it’s given a name in the format CVE–. There are also scoring systems for CVEs, like the CVSS (Common Vulnerability Scoring System), which assigns a score based on a series of categories, such as how easy the vulnerability is to exploit, whether any prior access or authentication is required, as well as the impact the exploit could have.
CVSS (Common Vulnerability Scoring System)
Part of CVE lingo. A CVSS score of 10 as “achieved” by SAP in CVE-2025-31324 is the worst of the worst.
d-marc (Demarcation panel)
Telecom concept: a board where the handoff from cables from the street meet cables frmo the data center.
DAS (Distributed Antenna System)
An extensive network of strategically placed antennas throughout a building to enhance cellular coverage where it’s needed.
DAST (Dynamic Application Security Testing)
Data at rest
Data in motion
Data Plane
A physical security appliance separates data traffic from its management traffic, which transits the managemenbt plane.
Data Remanence
The residual representation of data that remains even after attempting to erase or initialize RAM.
DB (DataBase)
DBA (DataBase Admin)
DCV (Domain Control Validation)
See OV.
DCVaaS (Domain Control Validation as a Service)
CSC likes this term which concerns how certificates get created.
DDI (DNS, DHCP and IP address management)
Debian Linux
A nice distro which I prefer. It is free and open source. Its packages are relatively uptodate.
Deduplication
A data optimization technique used to eliminate duplicate copies of data.
Deep Learning
A subset of machine learningthat focus on using deep neural networks with multiple layers to model complex patterns in data.
Deepfake
A manipulated video or other digital representation produced by sophisticated machine-learning techniquies that yield seemingly realistic, but fabricated images and sounds.
DGA (Domain Generation Algorithm)
Auto-generated domain names used by C2 networks.
DHCP (Dynamic Host Control Protocol)
Distributed Cloud
A Gartner term for a SaaS service which runs over multiple cloud environments.
DLL (Dynamic Link Library)
It’s a Windows thing.
DMA (Digital Millenium Act)
A law intended to bring copyright into the digital age.
DNAC (DNA Center)
Cisco term. Managing network devices, automating network operations, etc.
DNAT (Destination NAT)
DNS (Domain Name System)
DNSSEC (Domain Name System Security Extensions)
DOA (Dead on Arrival)
Usage: That equipment arrived DOA!
Docker
DoH (DNS over HTTPS)
Domain
Downselect
Reducing the number of vendors under consideration during the RFP process. Term maybe only used in companies where I have worked??
dp (data independent pixel)
Unit which assumes a screen resolution of 160 pixels per inch.
DR (Disaster Recovery)
DRDC (Disaster Recovery Data Center)
Perhaps only used at my company?
DRM (Digital Rights Management)
DTLS (Datagram Transport Layer Security)
A communications protocol providing security to datagram-based applications by allowing them to communicate in a way designed to prevent eavesdropping, tampering, or message forgery.
DVI (DeVice Independent file)
See LaTEX entry.
EAP
East-West
Data movement with a data center, I believe, as oppose to North-South.
EBITDA (Earnings Before Interest, Taxes, Depreciation and Amortization)
Hey, an IT person needs to know some business terminology!
ECC (Elliptic Curve Cryptography)
Encryption type stronger than RSA
EDT
The first editor in the VAX/VMS world. It got renamed to TPU.
Eduroam
Enhanced Factory Reset (EFR)
Entra
From Microsoft. The new name for Azure AD
EntraID
Another way to refer to Entra from Microsoft.
ERM (Enterprise Risk Management)
ERP (Enterprise Resource Planning)
Expensive, monolithic software delivered by the likes of SAP. Typically used by large enterprises.
ERRP (Expired Registration Recovery Policy)
It’s an ICANN-specific acronym.
ETR (Estimated Time to Restore)
EU AI Act
EULA (End User License Agreement)
Exact Data Matching (EDM)
FAQ (Frequently Asked Questions)
FE (Field Engineer)
A network vendor sends out an FE to a down site.
Fedora Linux
Free and open source linux. New features are introduced here before migrating into Redhat Linux
FEX (Fabric Extender)
FIDO (Fast Identity Online)
E.g., “fido stick” for passwordless authentication.
FIFO (First in, First Out)
FIPS (Federal Information Processing Standard)
Government security practices. Best to avoid if possible.
FM (Fabric Manager)
I.e., the Gigamon Fabric Manager. A kind of informal acronym I just heard being used.
Fortran
A very basic procedural programming language once popular in the scientific and engineering communities.
Fuzzy Logic
Uses non-exact matching.
FMO (Future Mode of Operation)
As opposed to CMO.
FN (False Negative)
FO (Fiber Optic)
An informal abbreviation used by networking folks.
Forensics
Fortran
An ancient procedural programming language popular in the scientific and engineering communities from decades ago.
FOSS (Free and Open Source Software)
FP (False Positive)
FQDN (Fully Qualified Domain Name)
DNS term, e.g., support.paloaltonetworks.com as opposed to simply “support”
freeBSD
A Unix variant which still exists today.
Fritz!Box
A popular home router in Germany.
(Azure) Front Door
A scalable and secure entry point for fast delivery of global web applications. Might appear in a FQDN as asdasd-fd.azurefd.net
FTE (Full Time Equivalent)
FW (Firewall)
GA (General Availability)
Gartner Group
A well-regarded research firm which reviews software and SaaS products. They decide which vendors are in the Magic Quadrant.
GBIC
A type of fiber optic transceiver that converts electric signals to optical signals.
GCP (Google Cloud Provider)
GDPR (General Data Protection Regulation)
An EU directive to achieve data privacy.
Generative AI
AI which can create new human-quality content, including text, images, audio or video.
Ghostscript
An open source postscript implementation.
GMP (Good Manufacturing Practice)
FDA lingo that implies their rules are being followed.
GMT – see UTC
gopher
An information retrieval protocol popular with libraries just prior to the web taking off.
GP (Global Protect)
Palo Alto Network’s name for their VPN offering.
GPT (Generative Pre-trained Transformer)
Perhaps the GPT in ChatGPT?
GPU (Graphical Processing Unit)
GPMI (General Purpose Media Interface)
The successor to HDMI in China.
GRC (Governance, Risk, and Compliance)
GRE
An encrypted tunneling protocol.
GRUB (probably stands for something silly because it’s linux after all)
Linux bootloader.
GSLB (Global Server Load Balancing)
Intelligent DNS-based load-balacing.
GSMO (Global Service Module Owner)
Not sure how widespread this usage is!
Guacamole
Or Apache Guacamole. An open source clientless remote desktop gateway often used in labs for training purposes
GUI (Graphical User Interface)
HA (High Availability)
Hallucination
When an LLM perceives patterns that are non-existent creating nonsensical or inaccurate outputs.
Hands and Eyes
When you don’t have physical access to a server, you need someone who does to be this for you.
A DDI vendor whose products are considered best-in-class.
InTune
Used for enterprise software management, originally on smartphones, then extended to Windows and MAC OS.
IP (Internet Protocol)
IPv4 (Internet Protocol version 4)
IPv6 (Internet Protocol version 6)
IPAM (IP Address Management)
IPI (IP Intelligence)
At least in the world of F5 this means IP Intelligence, i.e., the reputation of a given IP address.
IPS (Intrusion Prevention System)
IPSEC
ISC (Internet Systems Consortium)
They develop and maintain Internet infrastructuire software such as BIND.
ISC2 (International Information System Security Certification Consortium)
Organization which specializes in training and certifications for cybersecurity professionals. Nothing at all to do with ISC despite the similar name!
ISO
Image file.
ITOM (IT Operations Management)
iRule
F5 specific lingo for programmable control over load-balancing and routing decisions. Uses the TCL language.
ISC (Internet Software Consortium)
A body which maintains an open source reference implementation for DNS (BIND) and DHCP.
ISO 9001
ISP (Internet Service Provider)
ITIL (IT Infrastructure Library)
IXP (Internet eXchange Point)
Probably more an informal acronym. Refers to a place where major carriers hand off Internet traffic. Like Ashburn, Virginia.
Java
A language which was going to change the world until it was ruined by Oracle.
JMRT (Juniper Malware Removal Tool)
JSON (JavaScript Object Notation)
Pronounced JAY-son. A popluar format for data exchange. Sort of human-friendly. Example: {“hi”:”there”,”subnets_ignore”:[“10/8″,”192.168/16”]}
Kanban
Agile way of tracking progress on tasks and brief meetings.
KB (Knowledge Base)
Informal but common abbreviation, e.g., Read the KB article before opening an incident.
Kernel mode
Kerning
Adjusting the spacing between letters in a proportional font.
KEV (Known Exploited vulnerabilities)
CISA maintains this catalog.
K8s (Kubernetes)
Open source system for automating deployment, scaling, and management of containerized applications
KQL (Kusto Query Language)
Used to query large datasets in Azure.
KVM (Kernel Virtual Module)
L2TP (Layer 2 Tunneling Protocol)
L3, L4, L7 (Layer 3, Layer 4, Layer 7)
Refers to OSI 7-layer traffic model. Layer 1: physical layer; Layer 2: Data Link Layer with MAC addresses; Layer 3: Network layer with protocols IP, ICMP and ARP; Layer 4: Transport layer with protocols TCP and UDP; Layer 5: session layer; Layer 6 presentation layer; Layer 7: application layer such as SMTP, HTTP, etc.
LACP (Link Aggregation Control Protocol)
Where you combine several physical interfaces into one logical port channel.
LAMP (Linux Apache MySQL and PHP)
An application stack which gives a server needed software to do “interesting things.”
LaTEX
A markup language based on TEX I used to use to write a scientific paper. I think it gets transformed into a DVI, and then into a postscript file.
LDAP (Lightweight Directory Access Protocol)
LEC (Local Exchange Carrier)
Link
Linux
Lisp
A programming language used by computer science types?
LiveSP
A Cisco enterprise metrics tool to provide visibility into LAN and WAN.
LLD (Low Level Design)
LLD (Low Level Discovery)
A command-line browser for unix systems.
LLDP (Link layer Discovery Protocol)
See also CDP
An open source OS similar to Unix.
LLM (Large Langiuage Model)
LTE (Long Term Evolution)
A type of wireless broadband used by telecoms.
lynx
A command-line browser for linux systems.
MAC (Media Access Control) Address
Layer 2 address of a device, e.g., fa-2f-36-b4-8c-f5
Machine Learning
A subfield of AI that deals with creating systems that can learn from data and improve their performance without explicit programming.
Magic Quadrant
Gartner’s trademarked term for vendors who exceed in both completeness of vision and ability to execute.
Management Plane
See Data Plane.
Mandiant
MD5 (Message Digest 5)
MDF (Main Distribution Frame)
Patch panels in a server room. They connect to IDFs.
MDM (Mobile Device Management)
Management software used to administer smartphones and tablets.
MELT (Metrics, Events, Logs, and Traces)
An acronym in the Observability space.
MFA (Multi Factor Authentication)
Mishing
An obscure security company probably trying to make a name for itself invented this one which will probably never catch on. Mobile-first phishing techniques: Smishing (SMS/text-based phishing), Quishing (QR code phishing), voice phishing, Wi-Fi-based phishing and more!
But actually referred to as the .NET Remoting: Core Protocol Specification, which specifies a mechanism by which a calling program can invoke a method in a different address space over the network.
MSA (Modular Smart Array)
A SAN developed by HPE which features shared block-level storage.
MSI
A file type from Microsoft which is self-extracting and installs an application.
MSS (Maximum Segment Size)
Set by a TCP option in the beginning of the communcation.
MTTI (Mean Time To Identification)
Probably only Cisco uses this acronym e.g., in their ThousandEyes product.
MTTR (Mean Time To Resolution)
MTU (Maximum transmission unit)
Often 1500 bytes.
multicast
MVNO (Mobile Virtual Network Operator)
They buy network capacity frmo major US telecoms.
NAESAD (North American Energy Software Assurance Database)
Named pipes
I read it’s a Windows thing. huh. Hardly. It’s been on unix systems long before it was a twinkle in the eye of Bill gates. It acts like a pipe (|) except you give it a name in the filesystem and so it is a special file type. It’s used for inter-process communication.
NAT (Network Address Translation)
NDA (Non-Disclosure Agreement)
.NET
Netflow
Think of it like a call detail record for IP communications. Metadata for a communications stream.
Netscape
One of the original Internet-first companies. They built a pretty good browser which we used back in 1996. They also built web server and other server software and helped promulgate Java and javascript.
NFS (Network File System)
A file share protocol popular on Unix systems.
NGFW (Next Generation FireWall)
Palo Alto Networks describes their firewalls this way.
NGINX
A web server that is superioir to apache for most applications.
NIOS (Network Identity Operating System)
Core OS from Infoblox appliances.
NLP (Natural Language Processing)
A branch of AI that uses machine learning to enable computers to understand, interpret, and respond to human language.
NOC (Network Operations Center)
NNTP (Network News Transfer Protocl)
See Usenet.
North-South
Data movement from/to the data center. Also see East-West.
NQS (Network Queueing System)
We used to use NQS to distribute batch jobs amongst members of an Ultrix cluster.
NSA (National Security Agency)
NTLM
Relies on a three-way handshake between the client and server to authenticate a user.
NTU (Network Termination Unit)
Allows customer premises equipment to be connected to the switching equipment at the telco’s central office (CO)
Nvidia
World’s most advanced maker of chips used in AI.
OAuth bearer token
A security token with the property that any party in possession of the token (a “bearer“) can use the token in any way that any other party in possession of it can.
OCR (Optical Character Recognition)
OCSP
A service which tells you if a certificate has been revoked.
OIDC (OpenID Connect)
OKRs (Objectives and Key Results)
HR lingo.
OLAP (OnLine Analytical Processing)
Type of database which quickly responds to multi-dimensional queries.
OO (Object Oriented)
OOB (Out Of Band)
Example: the serial console of a security server.
OpenRoaming
openssl
A common open source implementation of SSL/TLS.
orca
A Microsoft editing tool – part of their SDK.
OS (Operating System)
OSFP (Open Shortest Path First)
OSI (Open Systems Interconnection)
OSS (Open Source Software)
OT (Operational Technology)
OTP (One-Time Password)
See also TOTP.
OV (Organization Validation)
A stronger form of SSL certificate validation than DCV. In OV CERTs, the CA verifies the legitimacy of the organization requesting the certificate. OV certificates display the organization’s name in the subject field.
An online community that produces freely available articles, methodologies, documentation, tools, and technologies in the fields of IoT, system software and web application security.
P2V (Physical to Virtual)
Migrating a physical server to a VM.
PaaS (Platform as a Service)
PAM (Privilege Access Management)
PAN-OS
Palo Alto Networks name for its firewall OS.
PAP
Pascal
A simple programming language used to teach programming concepts.
Patch
PaaS (Platform as a Service)
PBF (Policy Based Forwarding)
PBR (Policy Based Routing)
PCI (Payment Card International?)
A standard which seeks to define security practices around the handling of credit cards.
PDF (Portable Document File)
PDU (Protocol Data Unit)
PE (Provider Edge)
Telecom lingo so cisco uses this term a lot.
PEM (Privacy Enhanced Mail)
The format certificates are normally stored in.
PHP (Probably stands for something)
A scripting language often used to program back-end web servers.
Photoshop
adobe’s photo-editing software. Considered the premier option.
PII (Personally Identifiable Information)
Ping
I guess we all know what it means. Usually implemented with ICMP.
PIP
Package management system for python.
pixel
PKCS (Public Key Cryptography Standard)
PKI (Public Key Infrastructure)
Plain Text
A human-readable format, i.e., no encyrption and not a binary file.
PLC (Programmable Logic Controller)
PM (Product Manager)
Could also be Project Manager but for me it usually means Product Manager.
PO (Purchase Order)
POC (Point of Contact)
POC (Proof of Concept)
PoP (Point of Presence)
An Internet provider has POPs in various locales.
POP3 (Post Office Protocol)
A very old protocol for mail servers and mail clients.
Port Channel
Portable Executable (PE)
POS (Point Of Sale)
I.e., what used to be called the cash register.
POTS (Plain Old Telephone Service)
Voice-grade telephone service employing analog signal transmission over copper
POV (Proof of Value)
PPT (PowerPoint)
A Powerpoint file.
Private Cloud
Prompt Engineering
The practice of crafting effective prompts that elicit high-quality answers from generative AI tools.
PS (PostScript)
A file type I used to use. It is a vector-oriented language, stack-based, which tells A printer how to move its ink pens around the page. Before there was PDF, there was postscript.
PS (PowerShell)
A versatile scripting language developed by Microsoft and available on all Windows computers.
PS (Professional Services)
Most IT vendors have a professional services line of business which would love to charge you extra to make their product actually work.
PSTN (Public Switched Telephone Network)
PTO (Paid Time Off)
Purple Team
Purple teams combine red team and blue team functions. See Red Team.
Putty
A popular software which implements an ssh client.
PXE (pronounced “pixie”)
A protocol offering a host a way to boot up via its network card.
PyPi (Python Package Index)
Python
A popular programming language, not the snake.
QR (Quick Response)
Those funny pixelated black-and-white sqaures which usuall;y convey a URL.
QSFP (Quad Small Form factor Pluggable)
A newer kind of SFP.
Quad9
A public DNS resolver with IP 9.9.9.9 run by a Swiss non-profit.
Quishing
QR-code phishing.
R
A development language popular in the data science community.
A method to customize LLMs by allowing it to train on internal data sources.
Ray
An open-source unified compute framework used by the likes of OpenAI, Uber, and Amazon which simplifies the scaling of AI and Python workloads, including everything from reinforcement learning and deep learning to tuning and model serving.
RBAC (Role-Based Access Control)
RDAP (Registry Data Access Protocol)
Related to a domain’s whois information. See RFC 7482.
RDP (Remote Desktop Protocol)
Real Time
A real time OS is one which guarantees execution of the highest priority process.
Recursive
A function which calls itself.
Redhat Linux
A commercialized version of Fedora whose packages are always dated, usually by years.
Redirect
Relational Database
The traditional database with tables of rows of columns.
Remediation
Addressing a security flaw.
Remote Desktop Licensing (RDL) services
Often deployed on Windows severs with Remote Desktop Services deployed.
Responsive Design
Really, it just means an app alters its appearance to fit the device from which it is being used.
Retrieval-Augmented Generation (RAG)
Adding internal documents to your language model.
Reverse Engineer
To figure out the basic building blocks or code by first observing behavior of a system.
Reverse Proxy
A TCP gateway which terminates a tcp connection and maintains a separate tcp connection to a back-end server.
RFC (Request for Comment)
RFI (Requst for Information)
RFO (Reason for Outage)
RFP (Request for Proposal)
RFQ (Request for Quote)
RHSA (Redhat Security Advisory)
RIB (Routing Information base)
The route table as seen by a router, including AS paths.
RIPE
RIR (Regional Internet Registry)
The place where ASN <-> IP prefix pairs are registered. The RIRs are ARIN, RIPE, APNIC, LACNIC and AFRINIC.
RISC (Reduced Instruction Set Architecture)
A family of CPUs. As opposed to CISC.
RLHF (Reinforcement Learning from Human Feedback)
Where humans review output of LLM’s to help refine them.
RMA (Return Merchandise Authorization)
You hear this a lot when It guys need to get a replacement for failed equipment.
RMM (Remote Monitoring and Management)
A software platform that allows IT service providers to monitor and manage their clients’ IT systems remotely.
ROA (Route Origin Authorization)
ROCE (Return on Capital Employed)
Hey, an IT person has to know a few business terms!
Round Robin
A load balancing algorithm where each back-end server is used in a rotating sequence.
Route 53
In AWS-land, an intellugent DNS service, i.e., geoDNS +.
RPC (Remote Procedure Call)
RPKI (Resource Public key Infrastructure)
Provides a way to connect Internet number resource information to a trust anchor.
RPi (Raspberry Pi)
A popular small, inexpensive server aimed at the educational crowd.
RPM (Redhat Package Manager)
RPZ (Response Policy Zone)
A concept in DNS for either a DNS firewall or way to overwrite DNS responses.
RR (Resource Record)
RSA
Asymmetric encryption standard named after its creators, Ron Rivest, Adi Shamir and Leonard Adleman.
RSRP (Reference Signal Received Power)
Mobile network term.
RSRQ (Reference Signal Received Quality)
Mobile network term.
RSSI (Received Signal Strength Indicator)
It’s a mobile network term.
RTFM (Read The “flippin” Manual)
RTT (Round Trip Time)
s3
blob storage service in AWS
SaaS (Software as a Service)
SAMBA (SMB something or other)
Open source SMB implementation offered on Linux.
SAML (Security Association Markup language)
SAN (Storage Area Network)
SAN (Subject Alternative Name)
In certificate-land, an extension field which lists all the various names for which this certificate is authorized for.
SANS
Private outfit in the US which specializes in information security and cybersecurity training.
Sans-Serif
A font type which does not have the fancy rounded blobs at the tips of the letter, such as Helvetica.
SAP
The largest software company no one knows about because they sell hugely overpriced ERP systems to the few companies which can afford it.
SAS (Shared Access Signature)
Azure-specific term. Provides access rights to blobs, files, etc.
SASE (Secure Access Service Edge)
Palo Alto Networks likes to think they invented this term, but once Gartner started to use it they went on to embrace some other term. Or maybe it was the other way around.
SCADA (Supervisory Control and Data Acquisition)
That’s for OT stuff.
Scale sets
In cloud, a service which automates the build-up or tear-down of VMs behind a load balancer.
A timeshare operating system from DEC which I used in college.
TOTP (Time-based One-Time Password)
TPM (Trusted Platform Module)
TPM, a Microsoft security feature required by Windows 11, is a dedicated chip designed to provide “hardware-level security services for your device,” keeping your private information and credentials safe from unauthorized users.
TPU
My favorite editor in the VAX/VMS world. Successor of EDT.
TS (TroubleShooting)
Informal abbreviation.
TSA (Transitional Service Agreement)
May not be in widespread use.
TSF (Tech Support File)
Palo Alto Networks-specific lingo for a dump file they require for a firewall support case.
TSID (Threat Signature Indicator)
Only used in the world of Palo Alto Networks.
TW (Time Window)
Ubuntu Linux
A commercialized implementation of Debian Linux from Canonical.
UC (Unified Communications)
Cisco likes this term.
UC (Use Case)
udev rules
udev rules in Linux are used to manage device nodes in the /dev directory. Those nodes are created and removed every time a user connects or disconnects a device.
UFS (Unmanaged File Service)
Term probably specific to a company where I worked, but oh well, that’s how acronyms get started.
UEFI (Unified Extensible Firmware Interface)
It’s like the boot environment, used by Windows OSes.
UI5
SAP’s UI for HTML 5.
Ultrix
A legacy Unix variant which ran on DEC workstations in the 90’s.
Underlay
SD Wan terminology for the underlying network. As opposed to overlay.
Unit testing
UPS (Uninterruptible Power Supply)
URL
USB (Universal Serial Bus)
Usenet
In the old pre-reddit days, these were forums to discuss specific topics which had its own protocol, NNTP.
UTC (Universal Time Coordinated)
What used to be called GMT.
UTF-8
Common representation of common language characters. I think of it as a successor to ASCII.
Validated
In FDA parlance, an adjective used to describe a system which follows FDA controls. It’s usually a pain in the rear to run a validated system, e.g., as part of a GMP environment.
VAX (probably stands for something)
A legacy line of micro-computers sold by Digital Equipment Corporation, as in, the VAX 8600. The OS was called VMS.
VAX/VMS
See entry for VAX.
VDI
A virtual desktop offered by Citrix.
Veriexec (Verified Exec)
A Juniper device kernel-based file integrity subsystem that protects the OS from unauthorized code binaries
VCU (Video Conference Unit)
Cisco terminology.
VLAN
VM (Virtual Machine)
VM/CMS
A piece of crap operating system for IBM mainframes back in the day. As I recall essentially everything had to be submitted as a batch job.
VMSS (Virtual machine Scale Set)
Azure uses this abbreviation.
VMWare
Will Broadcom destroy this company the way they did to Bluecoat/Symantec?
VNC (Virtual Networking Computer)
VNC is a software used to remotely control a computer.
Vnet (Virtual Network)
Isolated network within a larger network in a cloud environment.
VOIP (Voice Over IP)
As opposed to analog phone lines.
VPC (Virtual Private Cloud)
vPC (Virtual Port Channel)
A virtual port channel (vPC) allows links that are physically connected to two different Cisco FEXes to appear as a single port channel by a third device.
VPG (Virtual Port Group)
A Cisco-ism.
VPN – Virtual Private Network
VRF
A logically separated network when using MPLS.
vsys
In PaloAlto Networks terminology, a virtual partition of a physical firewall so that multiple vsys can be on one physical box.
WAIS (Wide Area Information System, or something like that)
Another competitor to the world wide web. I believe Brewster Kahle was behind it?
WAP (Wireless Access Point)
WARP (Web Application Response Protocol)
Designed to improve the performance of web applications by optimizing the way data is transmitted over the internet.
Waterfall
A discredited approach to software development.
WEBDAV (Web Distributed Authoring and Versioning)
Webhook
Website
Whois
Old-timey service which gives you registrar info about a DNS domain. These days most everything is blocked for privacy reasons.
Wiki
A less formal and usually more collaborative approach to documentation, the prime example being Wikipedia.
Windows PE or Win PE
A small OS for repairing or restoring Windows systems.
WLC (Wireless LAN Controller)
WORM (Write Once Read Many)
As in WORM drive.
WSUS (Windows Server Update Services)
Enables administrators to manage the distribution of updates and hotfixes for Windows servers in an enterprise.
WWW (World Wide Web)
X
Formerly knownm as Twitter. Elon Musk’s disastrous attempt at social media.
x86
A type of processor architecture. Found in most Windows PCs.
XHR (XMLHttpRequest)
I.e., ajax.
XML (eXtensible Markup Language)
Common file format for data exchange, but not too human-friendly.
x-mosaic
This is the browser I used in 1993. It was the Mosaic browser for X-Windows, developed by none other than Marc Andreesson.
X-Windows
The GUI environment for Unix. Most of its utilities have names beginning with x such as xterm.
YAML
YARA
Zabbix
An open source infrastructure monitoring system.
XML (eXtensible Markup Language)
Markup language and file format for storing, transmitting, and reconstructing data. It defines a set of rules for encoding documents in a format that is both human-readable and machine-readable.
ZTNA (Zero Trust Network Architecture)
Assumes tha even on your Intranet you can’t trust anyone trying to access your systems until they’ve been vetted, each and every time.
I swear my bash programming skills are getting worse and worse. What I really need is a bash scripting tips blog entry to remind myself of my favorite bash scripting tips. I have this for python and I refer toit and add to it all the time. I don’t care if anyone else never uses it, it’s worth having all my used tips in one place as I find I constantly forget the basics due to infrequent usage.
Oh. So to the point. What this blog post is nominally about is to provide a useable medium-quality ping swep that a network security engineer would find useful.
Conditions
access to host on the subnet in question
this accessible host has a bash shell CLI, e.g., a Checkpoint firewall
ping and arp programs available
What it does
This script is designed to sweep through a /24 subnet, politely pausing one second per attempt. It send s a single PING to each IP. This is the things that makes it appealing to network security engineers. it does not require a reply, which is a common situation for network security appliances. It immediately checks the arp table afterwards to see if there is an arp entry (before that has a chance to age out). If so, it reports the IP as up.
#!/bin/bash

is_alive_ping()
{
  ping -c 1 -W 1 $1 > /dev/null
# arp -an output looks like: ? (10.29.129.208) at 01:c0:ed:78:b3:dc [ether] on eth0
# or if not present, like ? (10.29.129.209) at <incomplete> on eth0
  arp -an|grep -iv incomplete|grep -qi $1\)
  [ $? -eq 0 ] && echo Node with IP: $i is up.
}

if [[ ! -n $1 ]];
then
  echo "No subnet passed. Pass three octects like 10.29.129"
  exit
fi
subnet=$1
for i in ${subnet}.{1..254}
do
is_alive_ping $i
sleep 1
done
Apologies for the lousy programming. But it gets the job done.
./sweep.sh 10.29.129
Node with IP: 10.29.129.1 is up.
Node with IP: 10.29.129.2 is up.
Node with IP: 10.29.129.3 is up.
Node with IP: 10.29.129.5 is up.
Node with IP: 10.29.129.6 is up.
Node with IP: 10.29.129.10 is up.
Node with IP: 10.29.129.50 is up.
Conclusion
As a network security engineer you may be asked if it’s safe to use a paricular IP on one of your subnets where you have your equipment plus equipment frmo other groups. I provide a ping sweep script which reports which IPs are taken, not relying on an ICMP REPLY, but just on the ARP table entry which gets created if a device is on the network.
I was looking at what Cloudflare could do for my web site. A colleague pointed out that they have a free usage tier which supplies a web application firewall and some anti-bot measures. I checked it out and immedaitely signed up!
The details
What Cloudflare is supplying at no cost (for personal web sites like mine) is amazing. It’s not just a world-class dns service. That would already be amazing. Run dnscheker.org against drjohnstechtalk.com and you will see several different IPs mentioned around the world- just like the big guns! I also get for free some level of mitigation against dns-based attackes.
Web site protections
I don’t fully understand their products so I don’t know what level of protections I am getting in the free tier, but there are at least some! They say they’ve blocked 10 requests in the last few days
Web usage stats
I have to admin using raw linux tools against my apache access file hasn’t bee n the most illuminating until now. Now that I use Cloudflare I get a nice visual presentation showing where (which country) my visitors came from, where the bots come from, how much data was transmitted.
Certificate for HTTPS
Cloudflare automatically takes care of the web site certificate. I had to do nothing at all. So now I can forget my call out to LetsEncrypt. I wonder if GoDaddy is still charging $69 annually for their certificates.
Acceleration
Yeah my web site just feels faster now since the switch. It just does. And Cloudflare stats say that about 30% of the content has been served from their cache – all with zero setup effort on my part! I also believe they use certain tcp acceleration techniques to speed things up.
Cache
And Cloudflare caches some of my objects to boost performance. Considering that I pay for data transfer at Amazon AWS, it’s a fair question to ask if this caching could even be saving me money? I investigated this and found that I get billed maybe $ .02 per GByte, and in a busy month I might use .8 GB or so, so $ .02 per month. So I might occasionally save a penny or so – nothing substantial though!
geoDNS
Even with this free tier you get some geoDNS functionality for free, namely, visitors from around the world will see an IP address which is geographically close to where they are, bossting their performance when using your site. Stop to think about that. That’s a whole lot of infrastructure sophistication that they’re just giving you for free!
Why are they giving this much away?
I think they have the noble aim of improving the security posture of the Internet writ large. Much as letsencrypt greatly accelerated the adoptipon of web page encyrption (https) by making certificates free, Cloudflare hopes to accelerate the adoption of basic security measures for every web site, thereby lifting the security posture of the Internet as a whole. Count me as a booster!
What’s their business model. How will they ever make money?
Well, you’re only supposed to use the free tier for a personal web site, for one. My web sites don’t really have any usage and do not display ads so I think I qualify.
More importantly, the free security protections and acceleration are a kind of teaser and the path to upgrading to profesisonal tier is very visibly marked. So they’re not 100% altruistic.
Why I dislike GoDaddy
Let’s contrast this with offerings from GoDaddy. GoDaddy squeezes cents out of you at every turn. They make it somewhat mysterious what you are actually paying for so they’re counting on fear of screwing up (FOSU, to coin a term). After all, except for the small hit to your wallet, getting that upgraded tier – whois cloaking, anyone? – might be what you need. Who knows. Won’t hurt, right? But I get really tired of it. Amazon AWS is perhaps middle tier in this regards. They do have a free tier virtual server which I used initially. But it really doesn’t work except as a toy. My very modest web site overwhlemed it on too many occasions. So, basically useless. Everything else: you pay for it. But somehow they’re not shaking the pennies out of you at every turn unlike GoDaddy. And AWS even shows you how to optimize your spend.
How I converted my live site to Cloudflare
After signing up for Cloudflare I began to enter my dns domains, e.g., drjohnstechtalk.com, johnstechtalk.com, plsu a few others. They explained how at GoDaddy I had to update the nameserver records for these domains, which I did. Then Cloudflare has to verify these updates. Then my web sites basically stopped working. So I had to switch the encryption mode to full. This is done in Web sites > drjohnstechtalk.com > SSL/TLS > Overview. This mode encrypts the back-end data to my web server, but it accepts a self-signed certificate, no matter if it’s expired or not and no matter who issued it. That is all good because you still get the encrypted channel to your content server.
Then it began to work!
Restoring original visitor IPs to my apache web server logs
Very important to know from a technical standpoint that Cloudflare acts as a reverse proxy to your “content server.” Knowing this, you will also know that your content server’s apache logs get kind of boring because they will only show the Cloudflare IPs. But Cloudflare has a way to fix that so you can see the original IPs, not the Cloudlfare IPs in your apache logs.
Locking down your virtual server
If Internet users can still access the web server of your virtual server directly (bypassing Cloudflare), your security posture is only somewhat improved. To go further you need to use a local firewall. I debated whether to use AWS Network Security Groups or iptables on my centos virtual server. I went with iptables.
Note that this still leaves ssh open, but that’s ok since it is locked down via Network Security Group rules. No urgent need to change those.
Then I made sure that direct access to my content server freezes, which it does, and that access through the official DNS channels which use Cloudflare still works, which it did. So… all good. The setup was not hard at all. But since I have several hosted web sites for the iptables to make any sense I had to be sure to migrate all my hosted sites over to Cloudflare.
Not GoDaddy
I was dreading migrating my other zones (dns domains) over to Cloudflare. Still being in the GoDaddy mindframe I figured, sure, Cloudflare will permit me one zone for free, but then charge me for a second one.
So I plunged ahead. johnstechtalk.com. No charge!
And a third one: vmanswer.com. Also no charge!
And a fourth, and a fifth and a sixth.
I thought perhaps five will be the threshold. But it wasn’t. I only have six “zones” as Cloudflare now calls them. But they are all in my account and all free. Big relief. This is like the anti-GoDaddy.
DNS changes
Making DNS changes is quite fast. The changes are propagated within a minute or two.
I guess it’s accessible through ipv6 but I haven’t quite proven that yet.
Mail forwarding
I originally forgot that I had set up mail forwarding on GoDaddy. It was one of the few free things you could get. I think they switched native Outlook or something so my mail forwarding wasn’t working. On a lark I checked if Cloudflare has complementary mail forwarding for my domains. And they do! So that’s cool – another free service I will use.
Sending mail FROM this Cloudflare domain using your Gmail account
This is more tricky than simple mail forwarding. But I think I’ve got it working now. You use Gmail’s own server (smtp.gmail.com) as your relay. You also need to set up an app password for Gmail. Even though you need to specify a device such as Windows, it seems once enabled, you can send from this new account from any of your devices. I’ve found that you also need to update your TXT record (see link below) with an expanded SPF information:
In words it means the Google and Cloudflare sending servers are authorized to sends emails with this domain in the sender field, mail from elsewhere will be marked.
Even after all that I wasn’t seeing my sent message at work where Microsoft 365 is in use. It landed in the Junk folder! Why? The sending email “appears similar to someone who previously sent you email, but may not be that person.” Since I am a former mail admin I am sympathetic to what they’re trying to do – help hapless users avoid phishing; because it’s true – the characters in my test email did bear similarities to my regular email. My regular email is first_name.last_name @ gmail.com, while mail from this domain was first_name @ last_name + s .com Mail sent to a fellow Gmail user suffered no such fate however. Different providers, different approaches. So I can accept that. Once it’s set up you get a drop-down menu of sending addresses every time you compose a new message! The detailed instructions are at the Cloudflare community site.
Cost savings using Cloudflare
Suppose like me you only use GoDaddy as your registrar and get all your other services in some other way. Well, Cloudflare began to pitch me on transferring my domains to them. I thought, Aha, this is the moment they will make money off me. So I read their pitch. Their offer is to bill me for the charges they incur from ICANN or wherever, i.e., pass-through charges without any additional middleman overhead. It’s like, what? So let’s say at GoDaddy I pay $22 per year per domain. Well with Cloudflare I’d be paying something like $10 per year. For one domain I wouldn’t bother, but since I have more than five, I will be bothering and gladly leaving GoDaddy in the dust. I have just transferred the first two domains. GoDaddy seems to drag out the process as long as possible. I found I could expedite it by approving the transfer in the GoDaddy portal (https://dcc.godaddy.com/control/transfers). The trick there is that that one URL looks very different depending on whether or not a domain transfer is pending. If GoDaddy perceives a domain transfer has been initiated by an other registrar, it will show that page with a Transfer In and Transfer Out tabs. Just select Transfer Out and approve your domain for transfer. Then the transfer happens within five minutes. Otherwise that page is shown with no possibility to do a transfer out. So I guess you have to be patiennt, refresh it, or I don’t know what to get it to draw correctly. Once approved in the GoDaddy transfer out portal, Cloudflare had them within 5 minutes. It’s not super-easy to do a transfer, but also not impossble.
In typical GoDaddy style, executing a domain transfer to another registrar seems essentially impossible if you use their latest Domain portfolio app. Fortunately I eventually noticed the option to switch from “beta” to the old Domain manager, which still has the option and looks a bit more like their documentation. I’ve generated auth codes and unlocked, etc. And I even see the correct domain status (ok as opposed to client transfer prohibited) when I do a whois, but now Cloudflare, which is usually so quick to execute, seems to be lagging in recognizing that the domains have been unlocked and suggests to check back in some hours. Weird. The solution here was to provide my credit card info. Even 12 hours later I was having this trouble where it said none of my domains were eligible for transfer. As soon as I provided my payment information, it recognized two of my domains as eligible for transfer. In other cases Cloudflare recognized that domains were unlocked in a matter of 15 minutes or so. It may help to first unlock the domain in GoDaddy, then to view it in Cloudflare. Not sure.
A plug for GoDaddy
As my favorite sport seems to be bashing GoDaddy I wanted to balance that out and say a few kind words about them. Someone in my houisehold just started a job with a startup who uses GoDaddy. It provides desktop Outlook Email, MS Teams, Sharepoint, helps with consulting, etc. And on day one this person was up and running. So if you use their services, they definitely offer value. My issue is that I tried to restrict my usage to just one service – domain registrar – and they pushed me to use it more extensively, which I resisted. But for a small business which needs those thnigs, it’s fine.
How many domains are you sharing your IP with?
The thnig with Cloudflare is that they assign you to a couple of their IP addresses, often beginning with either 172.67 or 104…. . Now did you ever wonder with how many other web sites you’re sharing those IPs? If not, you should! I found a tool that provides the answer: https://dnslytics.com/ So for this free tier they seem to keep the number around 500 unique domains per IP! Yes that’s a lot, but I’d only be concerned if there was evidence of service degradation, which so far I have not seen. What’s nice about the dnsyltics site is that it lists a few of the domains – far from all of them, but at least it’s 20 or 30 – associated with a given IP. That can be helpful during truobleshooting.
Conclusion
What Cloudflare provides for protective and performance services represents a huge forward advance in the state of the art. They do not niggle you for extra charges (entice is more the word here) for Fear of Screwing Up.
All in all, I am amazed, and I am something of an insider – a professional user of such services. So I heartily endorse using Cloudflare for all personal web servers. I have not been sponsored or even in contact with Cloudflare, by the way!
It’s been awhile since I’ve had the opportunity to relatean IT mystery. After awhile they are repates of what’s already happened in the past, or it’s too complex to relate, or I was only peripherally involved. But today I came across a good one. It falls into the never been seen before category.
The details
A web server behind my web application firewall became unreachable. In the browser they get a message This site can’t be reached. The app owners came to me looking for input. I checked the WAF and it was fine. The virtual server was looking healthy. So I took a packet trace, something to this effect:
$ tcpdump -nni 0.0 host 192.168.2.124
14:00:45.180349 IP 192.68.1.13.42045 > 192.68.2.124.443: Flags [S], seq 1106553901, win 23360, options [mss 1460,sackOK,TS val 3715803515 ecr 0], length 0 out slot1/tmm3 lis=/Common/was90extqa.drjohn.com.app/was90extqa.drjohn.com_vs port=0.53 trunk=
14:00:45.181081 IP 192.68.2.124 > 192.68.1.13: ICMP host 192.68.2.124 unreachable - admin prohibited filter, length 64 in slot1/tmm2 lis= port=0.47 trunk=
14:00:45.181239 IP 192.68.1.13.42045 > 192.68.2.124.443: Flags [R.], seq 1106553902, ack 0, win 0, length 0 out slot1/tmm3 lis=/Common/was90extqa.drjohn.com.app/was9
0extqa.drjohn.com port=0.53 trunk=
I’ve never seen that before, ICMP host 192.68.2.124 unreachable – admin prohibited filter. But I know ICMP can be used to relay out-of-band routing information on occasion, though I do not see it often. I suspect it is a BAD THING and forces the connection to be shut down. Question is, where was it coming from?
The communication is via a firewall so I check the firewall. I see a little more traffic so I narrow the filter down:
$ tcpdump -nni 0.0 host 192.168.2.124host 443
And then I only see the initial SYN packet followed by the RST – from the same source IP! So since I didn’t see the bad ICMP packet on the firewall, but I do see it on the WAF, I preliminarily conclude the problem exists on the WAF.
Rookie mistake! Did you fall for it? So very, very often, in the heat of debugging, we invent some unit test which we’ve never done before, and we have to be satisified with the uncertainty in the testing method and hope to find a control test somehow, somewhere to validate our new unit test.
Although I very commonly do compound filters, in this case it makes no sense, as I realized a few minutes later. My port 443 filter would of course exclude logging the bad ICMP packets because ICMP does not use tcp port 443! So I took that out and re-run it. Yup. bad ICMP packet still present on the firewall, even on the interface of the firewall directly connected to the server.
So at this point I have proven to my satisfaction that this packet, which is ruining the communication, really comes frmo the server.
What the server guys say
Server support is outsourced. The vendor replies
As far as the patching activities go , there is nothing changed to the server except distro upgrading from 15.2 to 15.3. no other configs were changed. This is a regular procedure executed on almost all 15.2 servers in your environment. No other complains received so far…
So, the usual It’s not us, look somewhere else. So the app owner asks me for further guidance. I find it’s helpful to create a test that will convince the other party of the error with their service. And what is one test I would have liked to have seen but didn’t cnoduct? A packet trace on the server itself. So I write
I would suggest they (or you) do a packet trace on the server itself to prove to themselves that this server is not behaving ini an acceptable way, network-wise, if they see that same ICMP packet which I see.
The resolution
This kind of thing can often come to a stand-off, or many days can be wasted as an issue gets escalated to sufficiently competent technicians. In this case it wasn’t so bad. A few hours later the app owners write and mention that the home-grown local firewall seemed suspect to them. They dsabled it and this traffic began to work.
They are reaching out to the vendor to understand what may have happened.
Case: closed!
Conclusion
An IT mystery was resolved today – something we’ve never seen but were able to diagnose and overcome. We learned it’s sometimes a good thing to throw a wider net when seeing unexpected reset packets because maybe just maybe there is an ICMP host unreachable packet somewhere in the mix.
Most firewalls would just drop packets and you wait for a timeout. But this was a homegrown firewall running on SLES 15. So it abides by its own ways of working, I guess. So because of the RST, your connection closes quickly, not timing out as with a normal network firewall.
As always, one has to maintain an open mind as to the true source of an issue. What was working yesterday does not today. No one admits to changing anything. Finding clever ad hoc unit tests is the way forward, and don’t forget to validate the ad hoc test. We use curl a lot for these kinds of tests. A browser is a complex beast and too much of a black box.
The headline says it all. I got my shiny brand new Verizon hotspot from Walmart. I managed to activate it and add it to my Verizon account (not super easy, but after a few stumbles it did work.) I tried it out my home PC – works fine. I tried it out on my work PC. No good. My Global Protect connection was unstable. It connects for about a minute, then disconnects, then connects, etc. Basically unusable.
The details
I have heard of possible problem with the GP client (version 5.2.11) and IPv6. So I looked to see if this hotspot could be handing out IPv6 info. Yes. It is. But is that really making a difference? I concocted a simple test. I disabled IPv6 on my Wi-Fi adapter, then re-tested the GP client. The connection was smooth as glass! No disconnects!
Disable ipv6 on your Wi-Fi adapter
Bring up a powershell as administrator. Then:
get-netadapterbinding -componentid ms_tcpip6
will show you the current state of ipv6 on your adapters.
But, having done all that, I can only occasionally connect to GP. It seems to work slightly better at night. ipv6 does not seem to be the sole hiccup. No idea what the recipe for reliable success is. If I ever learn it I will publish it. Meanwhile, my phone’s hotspot, also VErizon, also handing out ipv6 info, usually permits me to connect to GP. It’s hard to see the difference.
Conclusion
The Verizon Airspeed Hotspot sends out a mix of IPv6 and IPv4 info to dhcp clients. Palo Alto Networks’ Global Protect client does not play well with that setup and wil not have a stable connection.
I do not think there is a way to disable IPv6 on the hotspot. However, for those with admin access it can be disabled on a Windows PC. And then GP will work just fine. Or not.
Oh, and by the way, otherwise the Airspeed works well and is an adequate solution where you need a good reliable hotspot. Well, in fact, don’t expect reliability like you have from a wired connection. After a couple hours, all users just got dropped for no apparent reason whatsoever.
Imagine an infrastructure team empowered to create its own scripts to do such things as regularly update external dynamic lists (EDLs) or interact with APIs in an automated fashion. At some point they will want to have a meta script in place to check the output of the all the automation scripts. This is something I developed to meet that need.
I am getting tired of perl, and I still don’t know python, so I decided to enhance my bash scripting for this script. I learned some valuable things along the way.
#!/bin/bash
# DrJ 2021/12/17, updated 2023/7/26
# it is desired to run this using the logrotate mechanism
#
# logrotate invokes with /bin/sh so we have to do this trick...
if [ ! "$BASH_VERSION" ] ; then
  exec /bin/bash "$0" "$@"
  exit
fi
DIR=$(cd $(dirname $0);pwd)
INI=$DIR/log.ini
DAY=2 # Day of week to analyze full week of logs. Monday is 1, Tuesday 2, etc
DEBUG=0
maxdiff=10
maxerrors=10
minstarts=10
TMPDIR=/var/tmp
cd $TMPDIR
recipients="drjohn@drjohns.com"
#
checklog2() {
  starts=0;ends=0;errors=0
  [[ "$DEBUG" -eq "1" ]] && echo ID, $ID, LPATH, $LPATH, START, $START, ERROR, $ERROR, END, $END
  LPATH="${LPATH}${wildcard}"
# the Ec switches mean (E) extnded regular expressions, (c) count of matching lines
  zgrep -Ec "$START" ${LPATH}|cut -d: -f2|while read sline; do starts=$((starts + sline));echo $starts>starts; done
  zgrep -Ec "$END" ${LPATH}|cut -d: -f2|while read sline; do ends=$((ends + sline));echo $ends>ends; done
# Outlook likes to remove our newline characters - double up on them with this sed trick!
  zgrep -Ec "$ERROR" ${LPATH}|cut -d: -f2|sed 'a\\'|while read sline; do errors=$((errors + sline));echo $errors>errors; done
  exampleerrors=$(zgrep -E "$ERROR" ${LPATH}|head -10)
  starts=$(cat starts)
  ends=$(cat ends)
  errors=$(cat errors)
  info="${info}===========================================
$ID SUMMARY
  Total starts: $starts
  Total finishes: $ends
  Total errors: $errors
  Most recent errors: "
  info="${info}${exampleerrors}

"
  unset NEW
# get cumulative totals
  starttot=$((starttot + starts))
  endtot=$((endtot + ends))
  errortot=$((errortot + errors))
  [[ "$DEBUG" -eq "1" ]] && echo starttot, $starttot, endtot, $endtot, errortot, $errortot
  [[ "$DEBUG" -eq "1" ]] || rm starts ends errors
} # end of checklog2 function

checklog() {
# clear out stats and some variables
starttot=0;endtot=0;errortot=0;info=""
#this IFS and following line is trick to preserve those darn backslash charactes in the input file
IFS=$'\n'
for line in $(<$INI); do
  [[ "$line" =~ ^# ]] || {
  pval=$(echo "$line"|sed s'/: */:/')
  lhs=$(echo $pval|cut -d: -f1)
  rhs=$(echo "$pval"|cut -d: -f2-)
  lhs=$(echo $lhs|tr [:upper:] [:lower:])
  [[ "$DEBUG" -eq "1" ]] && echo line is "$line", pval is $pval, lhs is $lhs, rhs is "$rhs"
  if [ "$lhs" = "identifier" ]; then
    [[ "$DEBUG" -eq "1" ]] && echo matched lhs = identifer section
    [[ -n "$NEW" ]] && checklog2
    ID="$rhs"
  fi
  [[ "$lhs" = "path" ]] && LPATH="$rhs" && NEW=false
  [[ "$lhs" = "error" ]] && ERROR="$rhs"
  [[ "$lhs" = "start" ]] && START="$rhs"
  [[ "$lhs" = "end" ]] && END="$rhs"
  }
done
# call one last time at the end
checklog2
} # end of checklog function

anomalydetection() {
# a few tests - you can always come up with more...
  diff=$((starttot - endtot))
  [[ $diff -gt $maxdiff ]] || [[ $starttot -lt $minstarts ]] || [[ $errortot -gt $maxerrors ]] && {
    ANOMALIES=1
    [[ "$DEBUG" -eq "1" ]] && echo ANOMALIES, $ANOMALIES, starttot, $starttot, endtot, $endtot, errortot, $errortot
  }
} # end function anomalydetection

sendsummary() {
  subject="Weekly summary of sesamstrasse automation scripts - please review"
  [[ -n "$ANOMALIES" ]] && subject="${subject} - ANOMALIES DETECTED PLEASE REVIEW CAREFULLY!!"

  intro="This summarizes the results from the past week of running automation scripts on sesamstrasse.
Please check that values seem reasonable. If things are out of range, check with Heiko or look at
sesamstrasse yourself.

"

  [[ "$DEBUG" -eq "1" ]] && echo subject, $subject, intro, "$intro", info, "$info"
  [[ "$DEBUG" -eq "1" ]] && args="-v"
  echo "${intro}${info}"|mail "$args" -s "$subject" "$recipients"
} # end function sendsummary

# MAIN PROGRAM
# always check the latest log
checklog
anomalydetection

# only check all logs if it is certain day of the week. Monday = 1, etc
day=$(date +%u)
[[ "$DEBUG" -eq "1" ]] && echo day, $day
[[ $day -eq $DAY ]] || [[ -n "$ANOMALIES" ]] && {
  [[ "$DEBUG" -eq "1" ]] && echo calling checklog with wildcard set
  wildcard='*'
  checklog
  sendsummary
}

[[ "$DEBUG" -eq "1" ]] && echo message so far is "$info"
# The suggestion: To have a configuration file with log identifiers
#(e.g. “anydesk-edl”) and per identifier: log file path (“/var/log/anydesk-edl.log”),
# error pattern (“.+\[Error\].+”), start pattern (“.+\[Notice\] Starting$”) end pattern (“.+\[Notice\] Done$”).
#Then just count number of executions (based on start/end) and number of errors.

# the start/end/error values are interpreted as extended regular expressions - see regex(7) man page
identifier: anydesk-edl
path: /var/log/anydesk-edl.log
error: .+\[Error\].+
start: .+\[Notice\] Starting$
end: .+\[Notice\] Done$

identifier: firewall-requester-to-edl
path: /var/log/firewall-requester-to-edl.log
error: .+\[Error\].+
start: .+\[Notice\] Starting$
end: .+\[Notice\] Done$

identifier: sase-ips-to-bigip
path: /var/log/sase-ips-to-bigip.log
error: .+\[Error\].+
start: .+\[Notice\] Starting$
end: .+\[Notice\] Done$
What this script does
So when the guy writes an automation script, he is so meticulous that he follows the same convention and hooks it into the syslogger to create uniquely named log files for it. He writes out a [Notice] Starting when his script starts, and a [Notice] Done when it ends. And errors are reported with an [Error] details. Some of the scripts are called hourly. So we agreed to have a script that checks all the other scripts once a week and send a summary email of the results. I look to see that the count of starts and ends is roughly the same, and I report back the ten most recent errors from a given script. I also look for other basic things. That’s the purpose of the function anomalydetection in my script. It’s just basic tests. I didn’t want to go wild.
But what if there was a problem with one of the scripts, wouldn’t we want to know sooner than possibly six days later? So I decided to have my script run every day, but only send email on the off days if an anomaly was detected. This made the logic a tad more complex, but nothing bash and I couldn’t handle. It fits the need of an overworked operational staff.
Techniques I learned and re-learned from developing this script
cron scheduling – more to it than you thought
I used to naively think that it suffices to look into the crontab files of all users to discover all the scheduled processes. What I missed is thinking about how log rotate works. How does it work? Turns out there is another section of cron for jobs run daily, weekly and monthly. logrotate is called from cron.daily.
logrotate – potential to do more
The person who wrote the automation scripts is a much better scripter than I am. I didn’t want to disappoint so I put in the extra effort to discover the best way to call my script. I reasoned that logrotate would offer the opportunity to run side scripts, and I was absolutely right about that! You can run a script just before the logs rotate, or just after. I chose the just before timing – prerotate. In actual fact logrotate calls the prerotate script with all the log files to be rotate as arguments, which you notice we don’t take advantage of, because at the time we were unsure how we were going to interface. But I figure let’s just leave it now. man logrotate to learn more.
By the way although I developed on a generic Debian system, it should work on a Raspberry Pi as well since it is Debian based.
BASH – the potential to do more, at a price
You’ll note that I use some bash-specific extensions in my script. I figure bash is near universal, so why not? The downside is that when logrotate invokes an external script, it calls is using old-fashioned shell. And my script does not work. Except I learned this useful trick:
if [ ! "$BASH_VERSION" ]; then
  exec /bin/bash "$0" "$@"
  exit
fi
Note this is legit syntax in SHELL and a legit conditional operator expression. So it means if you – and by you I mean the script talking about itself – are invoked via SHELL, then invoke yourself via BASH and exit the parent afterwards. And this actually does work (To do: have to check which occurs first, the syntax checking or the command invocation).
More
Speaking of that conditional, if you want to know all the major comparison tests, do a man test. I have around to use the double bracket expressions [[ more and more, though they are BASH specific I believe. The double bracket can be followed by a && and then an open curly brace { which can introduce a block of code delimited of course by a close curly brace }. So for me this is an attractive alternative to SHELL’s if conditional then code block fi syntax, and probably just slightly more compact. Replace && with || to execute the code block when the condition does not evaluate to be true.
zgrep is grep for compressed files, but we knew that right? But it’s agnostic – it works like grep on both compressed and uncompressed files. That’s important because with rotated logs you usually have a combination of both.
Now the expert suggested a certain regular expression for the search string. It wasn’t working in my first pass. I reasoned that zgrep may have a special mode to act more like egrep which supports extended regular expressions (EREs). EREs aren’t really the same as perl-compatible regular expressions (PCREs) but for this kind of simple stuff we want, they’re close enough. And sure enough zgrep has the -E option to force it to interpret the expression as an ERE. Great.
RegEx
So in the log.ini file the regular expression has a \[…\] syntax. The backslash is actually required because otherwise the […] syntax is interpreted as a character class, where all the characters between the brackets get tried to match a single character in the string to be matched. That’s a very different match!
My big thing was – will I have to further escape those lines read in from log.ini, perhaps to replace a \[ with a \\[? Stuff like that happens. I found as long as I used those double quotes around the variables (see below) I did not need to further escape them. Similarly, I found that the EREs in log.ini did not need to be placed between quotes though the guy initially proposed that. It looks cleaner without them.
Variable scope
I wasted a lot of time on a problem which I thought may be due to some weird variable scoping. I’ve memorized this syntax cat file|while read line; do etc, etc so I use it a lot in my tiny scripts. It’s amazing I got away with it as much as I have because it has one huge flaw. if you start using variables within the loop you can’t really suck them out, unless you write them to a file. So while at first I thought it was a problem of variable scoping – why do my loop variables have no values when the code comes out of the loop? – it really isn’t that issue. It’s that the pipe, |, created a forked process which has its own variables. So to avoid that I switched to this weird syntax for line in $(<$INI); do etc. So it does the line-by-line file reading as before but without the pipe and hence without the “variable scope” problem.
But in another place in the script – where I add up numbers – I felt I could not avoid the pipe. So there I do write the value to a file.
The conclusion is that with the caveat that if you know what you’re doing, all variables have global scope, and that’s just as it should be. Hey, I’m from the old Fortran 66/77 school where we were writing Monte Carlos with thousands of lines of code and dozens of variables in a COMMON block (global scope), and dozens of contributors. It worked just fine thank you very much. Because we knew what we were doing.
Adding numbers in bash
Speaking of adding, I can never remember how to add numbers (integers). In bash you can do starts=$((starts + sline)) , where starts and sline are integers. At least this worked in Debian linux Stretch. I did not really get the same to work so well in SLES Linux – at least not inside a loop where I most needed it.
When you look up how to add numbers in bash there are about a zillion different ways to do it. I’m trying to stick to the built-in way.
Sending mail in Debian linux
You probably need to configure a smarthost if you haven’t used your server to send emails up until now. You have to reconfigure of the exim4 package:
dpkg-reconfigure exim4-config
This also can be done on a RPi if you ever find you need for it to send out emails.
Variables
If a variables includes linebreaks and you want to see that, put it between double-quotes, e.g., echo “$myVariableWithLineBreaks”. If you don’t do that it seems to remove the linebreaks. Use of the double quotes also seems to help avoid mangling variables that contain meta characters found in regular expressions such as .+ or \[.
Result of executing the commands
I grew up using the backtick metacharacter, `, to indicate that the enclosed command should be executed. E.g., old way:
DIR=`dirname $0`
But when you think about it, that metacharacter is small, and often you are unlucky and it sits right alongside a double quote or a single quote, making for a visual trainwreck. So this year I’ve come to love the use of $(command to be executed) syntax instead. It offers much improved readability. But then the question became, could I nest a command within a command, e.g., for my DIR assignment? I tried it. Now this kind of runs counter to my philosophy of being able to examine every single step as it executes because now I’m executing two steps at once, but since it’s pretty straightforward, I went for it. And it does work. Hence the DIR variable is assigned with the compound command:
DIR=$(cd $(dirname $0);pwd)
So now I wonder if you can go more than two levels deep? Each level is an incrementally bad idea – just begging for undetectable mistakes, so I didn’t experiment with that!
By the way the reason I needed to do that is that the script jumps around to another directory to create temporary files, and I wanted it to be able to reference the full path to its original directory, so a simpler DIR=$(dirname $0) wasn’t going to cut it if it’s called with a relative path such as ./checklogs.sh
Debugging
I make mistakes left and right. But I know what results I expect. So I generously insert statements as variables get assigned to double check them, prefacing them with a conditional [[ $DEBUG -eq 1 ]] && print out these values. As I develop DEBUG is set to 1. When it’s finally working, I usually set it to 0, though in some script I never quite reach that point. It looks like a lot of typing, but it’s really just cut and paste and not over-thinking it for the variable dump, so it’s very quick to type.
Another thing I do when I’m stuck is to watch as the script executes in great detail by appending -xv to the first line, e.g., #!/bin/bash -xv. But the output is always confusing. Sometimes it helps though.
Compensating for Outlook’s newline handling
Outlook is too clever for its own good and “helpfully” removes what it considers extra linefeeds. Thanks Microsoft. Really helpful. So if you add extra linefeeds you can kind of get around that, but then you go from 0 linefeeds in the displayed output to two. Again, thanks Microsoft.
Anyway, I disocvered sed ‘a/\\/’ is a way to add an extra linefeed to my error lines, where the problem was especially acute and noticeable.
Techniques I’d like to use in the future
You can assign a function to a variable and then call that variable. I know that will have lots of uses but I’m not used to the construct. So maybe for my next program.
Conclusion
This fairly simple yet still powerful script has forced me to become a better BASH shell scripter. In this post I review some of the basics that make for successful scripting using the BASH shell. I feel the time invested will pay off as there are many opportunities to write such utility scripts. I actually prefer bash to perl or python for these tasks as it is conceptually simpler, less ambitious, less pretentious, yes, far less capable, but adequate for my tasks. A few rules of the road and you’re off and running! bash lends itself to very quick testing cycles. Different versions of bash introduced additional features, and that gets trying. I hope I have found and utilized some of the basic stuff that will be available on just about any bash implementation you are likely to run across.
References and related
The nitty gritty details about BASH shell can be gleaned by doing a man bash. It seems daunting at first but it’s really not too bad once you learn how to skim through it.
This post shows how to properly use the syslog package within python to create these log files that I parse.
Let’s say someone asks you to estimate the total bandwith used by a particular subnet, or a particular service such as https on port 443. I provide a crude way to do that using tcpdump on a not-too-busy server.
The code
I call it bandwidth.sh. By the way, I ran it on a Checkpoint Gaia appliance so it works there as well.
Running tcpdump with the -v switch gives us packet length. We find that length and sum it up. Here we used a filter epxression of 216.71/16 to capture only the traffic from that subnet.
The number of packets to capture has to be tuned to how busy it gets. Now it’s set to only capture 1000 packets. And you see my crude timings are truncated at the second. So 1000 packets in one second or about 1.5 MBytes/sec = 12 Mbps is the maximum sensitivy of this approach. I doub it will really work for interfaces with more thn 100 Mbps, even after you scaled up the count (and don’t forget to change the denominator in the kbps line!
Here’s a sample output:
1000 packets captured
2002 packets received by filter
0 packets dropped by kernel
5 kbps at Wed Nov 3 12:09:45 EDT 2021
I think it’s important to note the number of packets dropped by the kernel. So if it gets too busy as I underatdn it, it will at least try to tell yuo that it couldn’t capture all the data and at that point you can no longer trust this method. Perhaps with enhanced statistical methods it could be salvaged.
I don’t run it continuously to also give the kernel a breather. It probably doesn’t make much difference, but every two minutes seems plenty frequent to me…
Conclusion
We have demonstrated a crude but better-than-nothing script to calculate bandwidth for a given tcpdump filter expression. It won’t win any awards, but it contains some worthwhile ideas. And it seems to work at low bandwidth levels.