Categories
Admin Linux

Narrowing down answer to NPR puzzle with Linux commands

Intro
This is for CentOS and RedHat Linux.

Narrow things down
$ egrep ′^[a-z]{6}$′ /usr/share/dict/linux.words |sed ′s/.//′|s
ort|uniq -c|sort -k1 -d -r > 6-ltr-last-5

Mind the line break in the display of this command – you have to join things back together.

This is a great string of commands to study if you want to unleash the power of the linux shell. Yuo have a matching operator, egrep, a simple regular expression, a substitution command, sed, a sort command, sort, a unique sort command, uniq, and a sort ordered by number and displayed in reverse order. I issue commands like this frequently against log files and can do much more import work than solving an NPR puzzle.

6-ltr-last-5 starts like this:

     14 itter
     14 ingle
     14 atter
     14 agged
     13 etter
     13 ester
     13 aster
     13 apper
     13 apped
     13 agger
...

It has 772 lines with 4 or greater occurrences – too many to process by hand.

Edit this file and only keep the top part of the file up until the last of the 4 occurrences.

Now go back and match these words against the dictionary.

$ cat 6-ltr-last-5 |awk ′{print $2}′|while read line;do egrep ′
^[a-z]′$line$ /usr/share/dict/linux.words >> 6-ltr-combos;echo " ">>6-ltr-combos; done

6-ltr-combos starts like this:

bitter
fitter
gitter
hitter
jitter
kitter
litter
nitter
pitter
ritter
sitter
titter
witter
zitter
 
bingle
cingle
dingle
gingle
hingle
jingle
...

Small program to process that file
OK, to work with that file we just created based on the logic of the problem statement, I created this custom perl script which I call 6-5.pl:

#!/usr/bin/perl
$DEBUG = 0;
$consonants = 'bcdfghjlmnpqrstvwxyz';
$oldplace = -1;
$pot = 0;
while(<STDIN>){
  if (/^\s/) {
    print "pot,start word = $pot, $startword\n" if $pot > 3;
# reset some  values
    $oldplace = -1;
    $pot = 0;
    $startword = $_;
  }
  chomp;
# get at first character
  ($char) = /^(\w)/;
# turn character into position number with this
  $place = index $consonants,$char;
  print "word,place: $_,$place\n" if $DEBUG;
  if ($place != $oldplace + 1) {
# clear things out
    print "pot,start word = $pot, $startword\n" if $pot > 3;
    $pot  = 1;
    $startword = $_;
  } else {
    $pot++;
  }
  print "pot: $pot\n" if $DEBUG;
  $oldplace = $place;
}

I really wish I knew Python – I bet it would be an even shorter script in that language. But this gets the job done. It’s warts and all as I have done enough debugging to get it to return mostly reasonable output, but it’s still not quite right. It’s good enough…

Run it:

$ ./6-5.pl < 6-ltr-combos

pot,start word = 4, fitter
pot,start word = 7, gingle
pot,start word = 4, latter
pot,start word = 8, dagged
pot,start word = 5, fetter
pot,start word = 5, jester
pot,start word = 6, dagger
...

The biggest problem is my dictionary contains too many uncommon words, but at least that guarantees that the answer will indeed be present. And it is. In fact I found three sets of what I consider common words. One set are very ordinary words so i guess that is the intended answer. I can’t give away everything right now – you’ll have to do some work! I’ll post the answers after Sunday.

References and related
A similar approach to a previous puzzle is here.

Categories
Admin Web Site Technologies

The IT Detective agency: Outlook client is Disconnected, all else fine

Intro
Today we were asked to consult on the following problem. Some proxy users at a large company could not connect to Microsoft Outlook. Only a few users were affected. Fix it.

The details
Affected users would bring up Outlook and within a few short seconds it would simply show Disconnected and stay that way.

It was quickly established that the affected users shared this in common: they use LDAP authentication and proxy-basic-authentication. The users who worked used NTLM authentication. The way they distinguish one from the other is by using a different proxy autoconfiguration (PAC) file.

More observations
Well, actually there was almost no difference whatsoever between the two PAC files. They are syntactically identical. The only difference in fact is that a different proxy is handed out for the NTLM users. That’s it!

We were able to reproduce the problem ourselves by using the same PAC file as the affected user. We tried to trace the traffic on our desktop but it was a complete mess. I did not see any connection to the designated proxy for Outlook traffic, but it’s hard to say definitively because there is so much other junk present. Strangely, all web sites worked OK and even the web-based version of Outlook works OK. So this Outlook client was the only known application having a problem.

When the affected users put in the proxy directly in manual proxy settings in IE and turned off proxy autoconfig, then Outlook worked. Strange.

We observed the header for the PAC file was a little bit inconsistent (it was being served from multiple web servers through a load balancer). The content-tyep MIME header was coming back as either text/plain or there was no such header at all, depending on which web server you were hitting. But note that the NTLM users were also getting PAC files with this same header.

The solution

Although everything had been fine with this header situation up until the introduction of Outlook, we guessed it was technically incorrect and should be fixed. We changed all web servers to have the PAC file be served with this MIME header:

Content-Type: application/x-ns-proxy-autoconfig

The results

A re-test confirmed that this fixed the Outlook problem for the LDAP-affected users. NTLM users were not impacted and continued to work fine.

Conclusion
A strange Outlook connection problem was resolved in large company Intranet by adjusting the PAC file to include the correct content-type header. Case closed!

References and related information
Here’s a PAC file case we never did resolve: excessive calls to the PAC file web server from individual users.

Categories
Admin

SiteScope keeps restarting

Intro
I’m just documenting what the support tech had me do to fix this scary issue.

The details
This was a SiteScope v 11.24 instance running on a RHEL 6.6 VM.

2015-12-08 05:12:56,768 [SiteScope Main Thread] (SiteScopeSupport.java:721) ERROR - SiteScope unexpected shutdown
java.lang.reflect.UndeclaredThrowableException
        at com.sun.proxy.$Proxy106.postInit(Unknown Source)
        at com.mercury.sitescope.platform.configmanager.ConfigManager$PersistencyAdaptor.initPersistObjectsAfterLoad(ConfigManager.java:1967)
        at com.mercury.sitescope.platform.configmanager.ConfigManager$PersistencyAdaptor.initialize(ConfigManager.java:1247)
        at com.mercury.sitescope.platform.configmanager.ConfigManager$PersistencyAdaptor.access$300(ConfigManager.java:1112)
        at com.mercury.sitescope.platform.configmanager.ConfigManager.initialize(ConfigManager.java:145)
        at com.mercury.sitescope.platform.configmanager.ConfigManagerSession.initialize(ConfigManagerSession.java:153)
        at com.mercury.sitescope.bootstrap.SiteScopeSupport.initializeSiteScope(SiteScopeSupport.java:592)
        at com.mercury.sitescope.bootstrap.SiteScopeSupport.configureSiteScope(SiteScopeSupport.java:629)
        at com.mercury.sitescope.bootstrap.SiteScopeSupport.siteScopeMain(SiteScopeSupport.java:678)
        at com.mercury.sitescope.web.servlet.InitSiteScope$SiteScopeMainThread.run(InitSiteScope.java:233)
Caused by: java.lang.reflect.InvocationTargetException
        at sun.reflect.GeneratedMethodAccessor109.invoke(Unknown Source)
        at sun.reflect.DelegatingMethodAccessorImpl.invoke(DelegatingMethodAccessorImpl.java:43)
        at java.lang.reflect.Method.invoke(Method.java:606)
        at com.mercury.sitescope.platform.configmanager.ManagedObjectConfigRef$ManagedObjectProxyHandler.invoke(ManagedObjectConfigRef.java:290)
        ... 10 more
Caused by: java.lang.ClassCastException: java.util.ArrayList cannot be cast to java.lang.String
        at com.mercury.sitescope.entities.monitors.MonitorGroup.readDynamic(MonitorGroup.java:445)
        at com.mercury.sitescope.entities.monitors.MonitorGroup.postInit(MonitorGroup.java:2001)
        ... 14 more
2015-12-08 05:12:56,776 [SiteScope Main Thread] (SiteScopeShutdown.java:51) INFO  - Shutting down SiteScope reason Exception: java.lang.reflect.UndeclaredThrowableException null...
2015-12-08 05:12:56,784 [ShutdownThread at Tue Dec 08 05:12:56 EST 2015] (SiteScopeGroup.java:1061) INFO  - Stopping dynamic counters flow...
2015-12-08 05:12:56,832 [ShutdownThread at Tue Dec 08 05:12:56 EST 2015] (SiteScopeGroup.java:1112) INFO  - Waiting 40 secs to allow monitors to complete.
2015-12-08 05:13:36,854 [ShutdownThread at Tue Dec 08 05:12:56 EST 2015] (SiteScopeGroup.java:1280) INFO  - Average Monitors Running: 0
2015-12-08 05:13:36,855 [ShutdownThread at Tue Dec 08 05:12:56 EST 2015] (SiteScopeGroup.java:1281) INFO  - Peak Monitors Per Minute: 0 at 7:00 pm 12/31/69
2015-12-08 05:13:36,855 [ShutdownThread at Tue Dec 08 05:12:56 EST 2015] (SiteScopeGroup.java:1283) INFO  - Peak Monitors Running: 0.0 at 7:00 pm 12/31/69
2015-12-08 05:13:36,855 [ShutdownThread at Tue Dec 08 05:12:56 EST 2015] (SiteScopeGroup.java:1284) INFO  - Peak Monitors Waiting: 0 at 7:00 pm 12/31/69

And this just kept happening and happening.

The solution
The support tech from HPE had me go in the groups directory and delete all files except those ending in .dyn and .config. Those directories are in the /opt/HP/SiteScope directory on my installation.

In the persistency directory we deleted all files ending in .tmp. But we made saved copies of the entire original groups and persistency directories elsewhere just in case.

The results
HP siteScope started just fine after that! A healthy siteScope startup includes lines like these:

2015-12-08 08:59:12,149 [SiteScope Main] (SiteScopeGroup.java:995) INFO  - Open your web browser to:
2015-12-08 08:59:12,149 [SiteScope Main] (SiteScopeGroup.java:996) INFO  -   http://10.192.136.89:8080
2015-12-08 08:59:12,180 [SiteScope Main] (SiteScopeGroup.java:324) INFO  - Starting common scheduler...
2015-12-08 08:59:12,273 [SiteScope Main] (SiteScopeGroup.java:344) INFO  - Starting maintenance scheduler...
2015-12-08 08:59:12,381 [SiteScope Main] (SiteScopeGroup.java:609) INFO  - Starting topaz manager
2015-12-08 08:59:12,384 [SiteScope Main] (SiteScopeGroup.java:611) INFO  - Topaz manager started.
2015-12-08 08:59:12,386 [SiteScope Main] (SiteScopeGroup.java:457) INFO  - Starting monitor scheduler...
2015-12-08 08:59:12,386 [SiteScope Main] (SiteScopeGroup.java:462) INFO  - Starting report scheduler...
2015-12-08 08:59:12,398 [SiteScope Main] (SiteScopeGroup.java:477) INFO  - Starting analytics scheduler...
2015-12-08 08:59:12,398 [SiteScope Main] (SiteScopeGroup.java:488) INFO  -
2015-12-08 08:59:12,398 [SiteScope Main] (SiteScopeGroup.java:489) INFO  - SiteScope is active...
2015-12-08 08:59:12,493 [SiteScope Main] (SiteScopeGroup.java:513) INFO  - SiteScope Starting all monitors
2015-12-08 08:59:12,830 [SiteScope Main] (SiteScopeGroup.java:517) INFO  - SiteScope Start monitors completed
2015-12-08 08:59:13,037 [SiteScope Main] (SiteScopeGroup.java:532) INFO  - SiteScope Startup Completed
2015-12-08 08:59:13,215 [SiteScope Main] (SiteScopeSupport.java:713) INFO  - SiteScope 11.24.241  build 165 process started at Tue Dec 08 08:59:13 EST 2015
2015-12-08 08:59:13,215 [SiteScope Main] (SiteScopeSupport.java:714) INFO  - SiteScope Start took 26 sec

Especially that last line.

The hypothesis
As the server had crashed the hypothesis is that one of the files must have gotten corrupted.

Conclusion
HP SiteScope which could not start was fixed by removing some older files. These files are not needed, either – your configuration will not be lost when you delete them.

Categories
Admin Network Technologies Proxy Security TCP/IP Web Site Technologies

The IT Detective Agency: Cisco Jabber stopped working for some using WAN connections

Intro
This is probably the hardest case I’ve ever encountered. It’s so complicated many people needed to get involved to contribute to the solution.

Initial symptoms

It’s not easy to describe the problem while providing appropriate obfuscation. Over the course of a few days it came to light that in this particular large company for which I consult many people in office locations connected via an MPLS network were no longer able to log in to Cisco Jabber. That’s Cisco’s offering for Instant Messaging. When it works and used in combination with Cisco IP phones it’s pretty good – has some nice features. This major problem was first reported November 17th.

Knee-jerk reactions
Networking problem? No. Network guys say their networks are running fine. They may be a tad overloaded but they are planning to route Internet over the secondary links so all will be good in a few days.
Proxy problem? Nope. proxy guys say their Bluecoat appliances are running fine and besides everyone else is working.
Application problem? Application owner doesn’t see anything out of the ordinary.
Desktop problem? Maybe but it’s unclear.

Methodology
So of the 50+ users affected I recognized two power users that I knew personally and focussed on them. Over the course of days I learned:
– problem only occurs for WAN (MPLS) users
– problem only occurs when using one particular proxy
– if a user tries to connect often enough, they may eventually get in
– users can get in if they use their VPN client
– users at HQ were not affected

The application owner helpfully pointed out the URL for the web-based version of Cisco Jabber: https://loginp.webexconnect.com/… Anyone with the problem also could not log in to this site.

So working with these power users who patiently put up with many test suggestions we learned:

– setting the PC’s MTU to a small value, say 512 up to 696 made it work. Higher than that it generally failed.
– yet pings of up to 1500 bytes went through OK.
– the trace from one guy’s PC showed all his packets re-transmitted. We still don’t understand that.
– It’s a mess of communications to try to understand these modern, encrypted applications
– even the simplest trace contained over 1000 lines which is tough when you don’t know what you’re looking for!
– the helpful networking guy from the telecom company – let’s call him “Regal” – worked with us but all the while declaring how it’s impossible that it’s a networking issue
– proxy logs didn’t show any particular problem, but then again they cannot look into SSL communication since it is encrypted
– disabling Kaspersky helped some people but not others
– a PC with the problem had no problem when put onto the Internet directly
– if one proxy associated with the problem forwarded the requests to another, then it begins to work
– Is the problem reproducible? Yes, about 99% of the time.
– Do other web sites work from this PC? Yes.

From previous posts you will know that at some point I will treat every problem as a potential networking problem and insist on a trace.

Biases going in
So my philosophy of problem solving which had stood the test of time is either it’s a networking problem, or it’s a problem on the PC. Best is if there’s a competition of ideas in debugging so that the PC/application people seek to prove beyond a doubt it is a networking problem and the networking people likewise try to prove problem occurs on the PC. Only later did I realize the bias in this approach and that a third possibility existed.

So I enthused: what we need is a non-company PC – preferably on the same hardware – at the same IP address to see if there’s a problem. Well we couldn’t quite produce that but one power user suggested using a VM. He just happened to have a VM environment on his PC and could spin up a Windows 7 Professional generic image! So we do that – it shows the problem. But at least the trace form it is a lot cleaner without all the overhead of the company packages’ communication.

The hard work
So we do the heavy lifting and take a trace on both his VM with the problem and the proxy server and sit down to compare the two. My hope was to find a dropped packet, blame the network and let those guys figure it out. And I found it. After the client hello (this is a part of the initial SSL protocol) the server responds with its server hello. That packet – a largeish packet of 1414 bytes – was not coming through to the client! It gets re-transmitted multiple times and none of the re-transmits gets through to the PC. Instead the PC receives a packet the proxy never sent it which indicates a fatal SSL error has occurred.

So I tell Regal that look there’s a problem with these packets. Meanwhile Regal has just gotten a new PC and doesn’t even have Wireshark. Can you imagine such a world? It seems all he really has is his tongue and the ability to read a few emails. And he’s not convinced! He reasons after all that the network has no intelligent, application-level devices and certainly wouldn’t single out Jabber communication to be dropped while keeping everything else. I am no desktop expert so I admit that maybe some application on the PC could have done this to the packets, in effect admitting that packets could be intercepted and altered by the PC even before being recorded by Wireshark. After all I repeated this mantra many times throughout:

This explanation xyz is unlikely, and in fact any explanation we can conceive of is unlikely, yet one of them will prove to be correct in the end.

Meanwhile the problem wasn’t going away so I kludged their proxy PAC file to send everyone using jabber to the one proxy where it worked for all.

So what we really needed was to create a span port on the switch where the PC was plugged in and connect a 2nd PC to a port enabled in promiscuous mode with that mirrored traffic. That’s quite a lot of setup and we were almost there when our power user began to work so we couldn’t reproduce the problem. That was about Dec 1st. Then our 2nd power user also fell through and could no longer reproduce the problem either a day later.

10,000 foot view
What we had so far is a whole bunch of contradictory evidence. Network? Desktop? We still could not say due to the contradictions, the likes of which I’ve never witnessed.

Affiliates affected and find the problem
Meanwhile an affiliate began to see the problem and independently examined it. They made much faster progress than we did. Within a day they found the reason (suggested by their networking person from the telecom, who apparently is much better than ours): the server hello packet has the expedited forwarding (EF) flag set in the differentiated code services point (DSCP) section of the IP header.

Say what?
So I really got schooled on this one. I was saying It has to be an application-aware “something” on the network or PC that is purposefully messing around with the SSL communication. That’s what the evidence screamed to me. So a PC-based firewall seemed a strong contender and that is how Regal was thinking.

So the affiliate explained it this way: the company uses QOS on their routers. Phone (VOIP) gets priority and is the only application where the EF bit is expected to be set. VOIP packets are small, by the way. Regular applications like web sites should just use the default QOS. And according to Wikipedia, many organizations who do use QOS will impose thresholds on the EF pakcets such that if the traffic exceeds say 30% of link capacity drop all packets with EF set that are over a certain size. OK, maybe it doesn’t say that, but that is what I’ve come to understand happens. Which makes the dropping of these particular packets the correct behaviour as per the company’s own WAN contract and design. Imagine that!

Smoking gun no more
So now my smoking gun – blame it on the network for dropped packets – is turned on its head. Cisco has set this EF bit on its server hello response on the loginp.webexconnect.com web site. This is undesirable behaviour. It’s not a phone call after all which requires a minimum jitter in packet timing.

So next time I did a trace I found that instead of EF flag being set, the AF (Assured Forwarding) flag was set. I suppose that will make handling more forgiving inside the company’s network, but I was told that even that was too much. Only default value of 0 should be set for the DSCP value. This is an open issue in Cisco’s hands now.

But at least this explains most observations. Small MTU worked? Yup, those packets are looked upon more favorably by the routers. One proxy worked, the other did not? Yup, they are in different data centers which have different bandwidth utilization. The one where it was not working has higher utilization. Only affected users are at WAN sites? Yup, probably only the WAN routers are enforcing QOS. Worked over VPN, even on a PC showing the problem? Yup – all VPN users use a LAN connection for their proxy settings. Fabricated SSL fatal error packet? I’m still not sure about that one – guess the router sent it as a courtesy after it decided to drop the server hello – just a guess. Problem fixed by shutting down Kaspersky? Nope, guess that was a red herring. Every problem has dead ends and red herrings, just a fact of life. And anyway that behaviour was not very consistent. Problem started November 17th? Yup, the affiliate just happened to have a baseline packet trace from November 2nd which showed that DSCP was not in use at that time. So Cisco definitely changed the behaviour of Cisco Jabber sometime in the intervening weeks. Other web sites worked, except this one? Yup, other web sites do not use the DSCP section of the IP header so it has the default value of 0.

Conclusion
Cisco has decided to remove the DSCP flag from these packets, which will fix everything. Perhaps EF was introduced in support of Cisco Jabber’s extended use as a soft phone??? Then this company may have some re-design of their QOS to take care of because I don’t see an easy solution. Dropping the MTU on the proxy to 512 seems pretty drastic and inefficient, though it would be possible. My reading of TCP is that nothing prevents QOS from being set on any sort of TCP packet even though there may be a gentleman’s agreement to not ordinarily do so in all except VOIP packets or a few other special classes. I don’t know. I’ve really never looked at QOS before this problem came along.

The company is wisely looking for a way to set all packets with DSCP = 0 on the Intranet, except of course those like VOIP where it is explicitly supposed to be used. This will be done on the Internet router. In Cisco IOS it is possible with a policy map and police setting where you can set set-dscp-transmit default. Apparently VPN and other things that may check the integrity of packets won’t mind the DSCP value being altered – it can happen anywhere along the route of the packet.

Boy applications these days are complicated! And those rare times when they go wrong really require a bunch of cooperating experts to figure things out. No one person holds all the expertise any longer.

My simplistic paradigm of its either the PC or the network had to make room for a new reality: it’s the web site in the cloud that did them in.

Could other web sites be similarly affected? Yes it certainly seems a possibility. So I now know to check for use of DSCP if a particular web site is not working, but all others are.

References and related
This Wikipedia article is a good description of DSCP: https://en.wikipedia.org/wiki/Differentiated_services

Categories
Admin CentOS Linux Security

The IT Detective Agency: WordPress login failure leads to discovery of ssh brute force attack

Intro
Yes my WordPress instance never gave any problems for years. Then one day my usual username/password wouldn’t log me in! One thing led to another until I realized I was under an ssh brute force attack from Hong Kong. Then I implemented a software that really helped the situation…

The details
Login failure

So like anyone would do, I double-checked that I was typing the password correctly. Once I convinced myself of that I went to an ssh session I had open to it. When all else fails restart, right? Except this is not Windows (I run CentOS) so there’s no real need to restart the server. There very rarely is.

Mysql fails to start
So I restarted mysql and the web server. I noticed mysql database wasn’t actually starting up. It couldn’t create a PID file or something – no space left on device.

No space on /
What? I never had that problem before. In an enterprise environment I’d have disk monitors and all that good stuff but as a singeleton user of Amazon AWS I suppose they could monitor and alert me to disk problems but they’d probably want to charge me for the privilege. So yeah, a df -k showed 0 bytes available on /. That’s never a good thing.

/var/log very large
So I ran a du -k from / and sent the output to /tmp/du-k so I could preview at my leisure. Fail. Nope, can’t do that because I can’t write to /tmp because it’s on the / partition in my simple-minded server configuration! OK. Just run du -k and scan results by eye… I see /var/log consumes about 3 GB out of 6 GB available which is more than I expected.

btmp is way too large
So I did an ls -l in /var/log and saw that btmp alone is 1.9 GB in size. What the heck is btmp? Some searches show it to be a log use to record ssh login attempts. What is it recording?

Disturbing contents of btmp
I learned that to read btmp you do a
> last -f btmp
The output is zillions of lines like these:

root     ssh:notty    43.229.53.13     Mon Oct 26 14:56 - 14:56  (00:00)
...

I estimate roughly 3.7 login attempts per second. And it’s endless. So I consider it a brute force attack to gain root on my server. This estimate is based on extrapolating from a 10-minute interval by doing one of these:

> last -f btmp|grep ‘Oct 26 14:5’|wc

and dividing the result by 10 min * 60 s/min.

First approach to stop it
I’m at networking guy at heart and remember when you have a hammer all problems look like nails 😉 ? What is the network nail in this case? The attacker’s IP address of course. We can just make sure packets originating from that IP can’t get returned form my server, by doing one of these:

> route add -host 43.229.53.13 gw 127.0.0.1

Check it with one of these:

> netstat -rn

Kernel IP routing table
Destination     Gateway         Genmask         Flags   MSS Window  irtt Iface
43.229.53.13    127.0.0.1       255.255.255.255 UGH       0 0          0 lo
10.185.21.64    0.0.0.0         255.255.255.192 U         0 0          0 eth0
169.254.0.0     0.0.0.0         255.255.0.0     U         0 0          0 eth0
0.0.0.0         10.185.21.65    0.0.0.0         UG        0 0          0 eth0

Then watch the btmp grow silent since now your server sends the reply packets to its loopback interface where they die.

Short-lived satisfaction
But the pleasure and pats on your back will be short-lived as a new attack from a new IP will commence within the hour. And you can squelch that one, too, but it gets tiresome as you stay up all night keeping up with things.

Although it wouldn’t bee too too difficult to script the recipe above and automate it, I decided it might even be easier still to find a package out there that does the job for me. And I did. It’s called

fail2ban

You can get it from the EPEL repository of CentOS, making it particularly easy to install. Something like:

$ yum install fail2ban

will do the trick.

I like fail2ban because it has the feel of a modern package. It’s written in python for instance and it is still maintained by its author. There are zillions of options which make it daunting at first.

To stop these ssh attacks in their tracks all you need is to create a jail.local file in /etc/fail2ban. Mine looks like this:

# DrJ - enable sshd monitoring
[DEFAULT]
bantime = 3600
# exempt CenturyLink
ignoreip = 76.6.0.0/16  71.48.0.0/16
#
[sshd]
enabled = true

Then reload it:

$ service fail2ban reload

and check it:

$ service fail2ban status

fail2ban-server (pid  28459) is running...
Status
|- Number of jail:      1
`- Jail list:   sshd

And most sweetly of all, wait a day or two and appreciate the marked change in the contents of btmp or secure:

support  ssh:notty    117.4.240.22     Mon Nov  2 07:05    gone - no logout
support  ssh:notty    117.4.240.22     Mon Nov  2 07:05 - 07:05  (00:00)
dff      ssh:notty    62.232.207.210   Mon Nov  2 03:38 - 07:05  (03:26)
dff      ssh:notty    62.232.207.210   Mon Nov  2 03:38 - 03:38  (00:00)
zhangyan ssh:notty    62.232.207.210   Mon Nov  2 03:38 - 03:38  (00:00)
support  ssh:notty    117.4.240.22     Sun Nov  1 22:47 - 03:38  (04:50)
support  ssh:notty    117.4.240.22     Sun Nov  1 22:47 - 22:47  (00:00)
oracle   ssh:notty    180.210.201.106  Sun Nov  1 20:44 - 22:47  (02:03)
oracle   ssh:notty    180.210.201.106  Sun Nov  1 20:44 - 20:44  (00:00)
a        ssh:notty    180.210.201.106  Sun Nov  1 20:44 - 20:44  (00:00)
openerp  ssh:notty    123.212.42.241   Sun Nov  1 20:40 - 20:44  (00:04)
openerp  ssh:notty    123.212.42.241   Sun Nov  1 20:40 - 20:40  (00:00)
dff      ssh:notty    187.210.58.215   Sun Nov  1 20:36 - 20:40  (00:04)
dff      ssh:notty    187.210.58.215   Sun Nov  1 20:36 - 20:36  (00:00)
zhangyan ssh:notty    187.210.58.215   Sun Nov  1 20:36 - 20:36  (00:00)
zhangyan ssh:notty    187.210.58.215   Sun Nov  1 20:35 - 20:36  (00:00)
root     ssh:notty    82.138.1.118     Sun Nov  1 19:57 - 20:35  (00:38)
root     ssh:notty    82.138.1.118     Sun Nov  1 19:49 - 19:57  (00:08)
root     ssh:notty    82.138.1.118     Sun Nov  1 19:49 - 19:49  (00:00)
PlcmSpIp ssh:notty    82.138.1.118     Sun Nov  1 18:42 - 19:49  (01:06)
PlcmSpIp ssh:notty    82.138.1.118     Sun Nov  1 18:42 - 18:42  (00:00)
oracle   ssh:notty    82.138.1.118     Sun Nov  1 18:34 - 18:42  (00:08)
oracle   ssh:notty    82.138.1.118     Sun Nov  1 18:34 - 18:34  (00:00)
karaf    ssh:notty    82.138.1.118     Sun Nov  1 18:18 - 18:34  (00:16)
karaf    ssh:notty    82.138.1.118     Sun Nov  1 18:18 - 18:18  (00:00)
vagrant  ssh:notty    82.138.1.118     Sun Nov  1 17:13 - 18:18  (01:04)
vagrant  ssh:notty    82.138.1.118     Sun Nov  1 17:13 - 17:13  (00:00)
ubnt     ssh:notty    82.138.1.118     Sun Nov  1 17:05 - 17:13  (00:08)
ubnt     ssh:notty    82.138.1.118     Sun Nov  1 17:05 - 17:05  (00:00)
...

The attacks still come, yes, but they are so quickly snuffed out that there is almost no chance of correctly guessing a password – unless the attacker has a couple centuries on their hands!

Augment fail2ban with a network nail

Now in my case I had noticed attacks coming from various IPs around 43.229.53.13, and I’m still kind of disturbed by that, even after fail2ban was implemented. Who is that? Arin.net said that range is handled by apnic, the Asia pacific NIC. apnic’s whois (apnic.net) says it is a building in Mong Kok district of Hong Kong. Now I’ve been to Hong Kong and the Mong Kok district. It’s very expensive real estate and I think the people who own that subnet have better ways to earn money than try to pwn AWS servers. So I think probably mainland hackers have a backdoor to this Hong Kong network and are using it as their playground. Just a wild guess. So anyhow I augmented fail2ban with a network route to prevent all such attacks form that network:

$ route add -net 43.229.0.0/16 gw 127.0.0.1

A few words on fail2ban

How does fail2ban actually work? It manipulates the local firewall, iptables, as needed. So it will activate iptables if you aren’t already running it. Right now my iptables looks clean so I guess fail2ban hasn’t found anything recently to object to:

$ iptables -L

Chain INPUT (policy ACCEPT)
target     prot opt source               destination
f2b-sshd   tcp  --  anywhere             anywhere            multiport dports ssh
 
Chain FORWARD (policy ACCEPT)
target     prot opt source               destination
 
Chain OUTPUT (policy ACCEPT)
target     prot opt source               destination
 
Chain f2b-sshd (1 references)
target     prot opt source               destination
RETURN     all  --  anywhere             anywhere

Indeed, checking my messages file the most recent ban was over an hour ago – in the early morning:

Nov  2 03:38:49 ip-10-185-21-116 fail2ban.actions[28459]: NOTICE [sshd] Ban 62.232.207.210

And here is fail2ban doing its job since the log files were rotated at the beginning of the month:

$ cd /var/log; grep Ban messages

Nov  1 04:56:19 ip-10-185-21-116 fail2ban.actions[28459]: NOTICE [sshd] Ban 185.61.136.43
Nov  1 05:49:21 ip-10-185-21-116 fail2ban.actions[28459]: NOTICE [sshd] Ban 5.8.66.78
Nov  1 11:27:53 ip-10-185-21-116 fail2ban.actions[28459]: NOTICE [sshd] Ban 61.147.103.184
Nov  1 11:32:51 ip-10-185-21-116 fail2ban.actions[28459]: NOTICE [sshd] Ban 118.69.135.24
Nov  1 16:57:05 ip-10-185-21-116 fail2ban.actions[28459]: NOTICE [sshd] Ban 162.246.16.55
Nov  1 17:13:17 ip-10-185-21-116 fail2ban.actions[28459]: NOTICE [sshd] Ban 82.138.1.118
Nov  1 18:42:36 ip-10-185-21-116 fail2ban.actions[28459]: NOTICE [sshd] Ban 82.138.1.118
Nov  1 19:57:55 ip-10-185-21-116 fail2ban.actions[28459]: NOTICE [sshd] Ban 82.138.1.118
Nov  1 20:36:05 ip-10-185-21-116 fail2ban.actions[28459]: NOTICE [sshd] Ban 187.210.58.215
Nov  1 20:44:17 ip-10-185-21-116 fail2ban.actions[28459]: NOTICE [sshd] Ban 180.210.201.106
Nov  2 03:38:49 ip-10-185-21-116 fail2ban.actions[28459]: NOTICE [sshd] Ban 62.232.207.210

Almost forgot to mention
How did I free up space so I could still examine btmp? I deleted an older large log file, secure-20151011 which was about 400 MB. No reboot necessary of course. Mysql restarted successfully as did the web servers and I was back in business logging in to my WP site.

August 2017 update
I finally had to reboot my AWS instance after more than three years. I thought about my ssh usage pattern and decided it was really predictable: I either ssh from home or work, both of which have known IPs. And I’m simply tired of seeing all the hack attacks against my server. And I got better with the AWS console out of necessity.
Put it all together and you get a better way to deal with the ssh logins: simply block ssh (tcp port 22) with an AWS security group rule, except from my home and work.

Conclusion
The mystery of the failed WordPress login is examined in great detail here. The case was cracked wide open and the trails that were followed led to discovery of a brute force attempt to gain root access to the hosting server. Methods were implemented to ward off these attacks. An older log file was deleted from /var/log and mysql restarted. WordPress logins are working once again.

References and related info
fail2ban is documented in a wiki of uneven quality at www.fail2ban.org.
Another tool is DenyHosts. One of the ideas behind DenyHosts – its capability to share data – sound great, but look at this page: http://stats.denyhosts.net/stats.html. “Today’s data” is date-stamped July 11, 2011 – four years ago! So something seems amiss there. So it looks like development was suddenly abandoned four years ago – never a good sign for a security tool.
Categories
Admin

SD Card reader not working after Windows 10 upgrade

Intro
I was more than a little alarmed after an upgrade of my Dell Inspiron with built-in SD card reader failed to work properly after I upgraded from Windows 7 to Windows 10. After the upgrade I inserted an SD card into the reader and nothing happened in File Explorer! this led to some tense moments.

The details
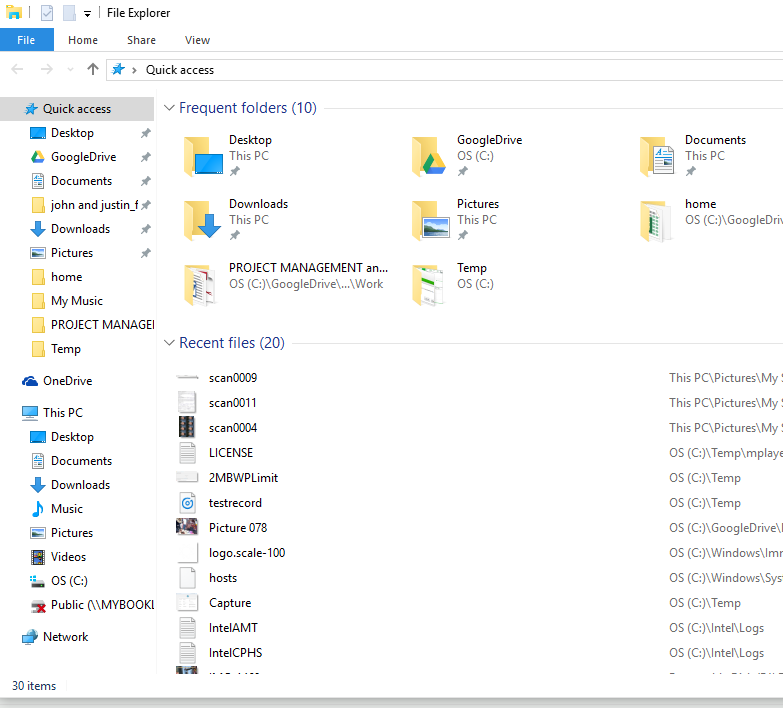
Here’s file Explorer after inserting the SD card:

File Explorer
File Explorer

The DVD drive is nowhere to be found and the same for SD card.

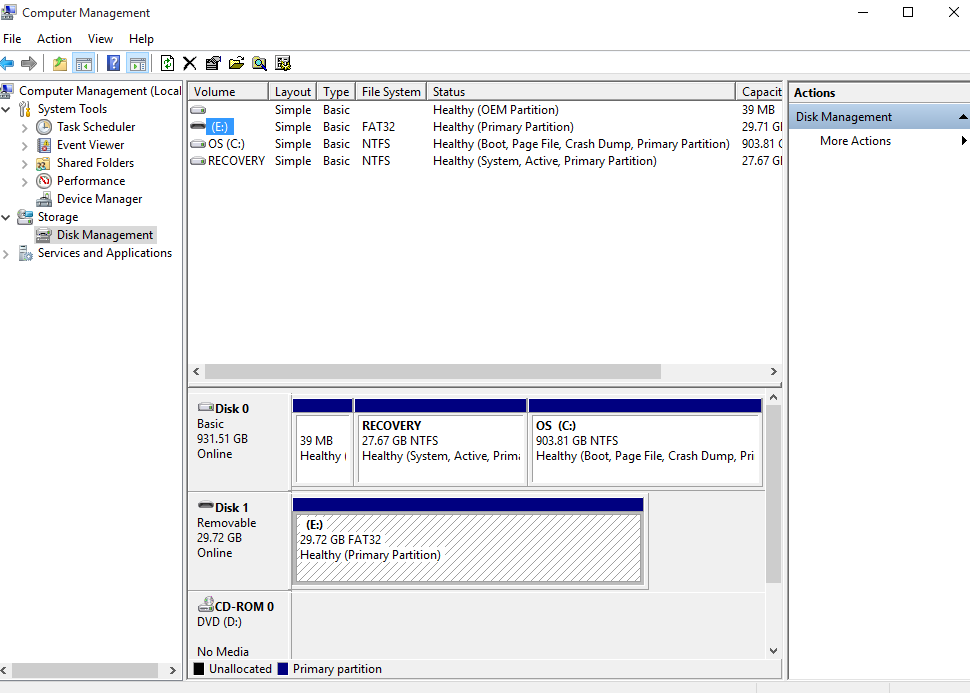
But if I right-click on This PC and select manage it looks like this:

Disk Management

So that would make it seem that Disk 1 is removable media mapped to the E: drive and my DVD player is mapped to the D: drive. Interesting. So let’s try this in File Explorer (known as Windows Explorer in previous version of Windows). Type

E:

in the field where it says Quick access. Sure enough it magically appears:

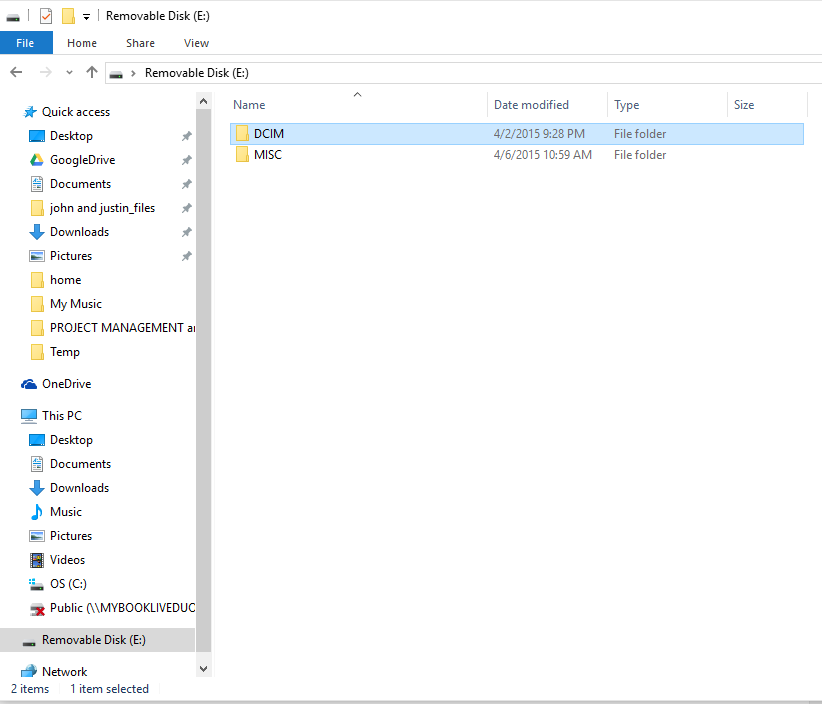
Now with E: Drive mapped

And I can do the normal File Explorer operations with it.

I think there is a more permanent fix but for me I have no problem typing e: the few times I need to read an SD card.

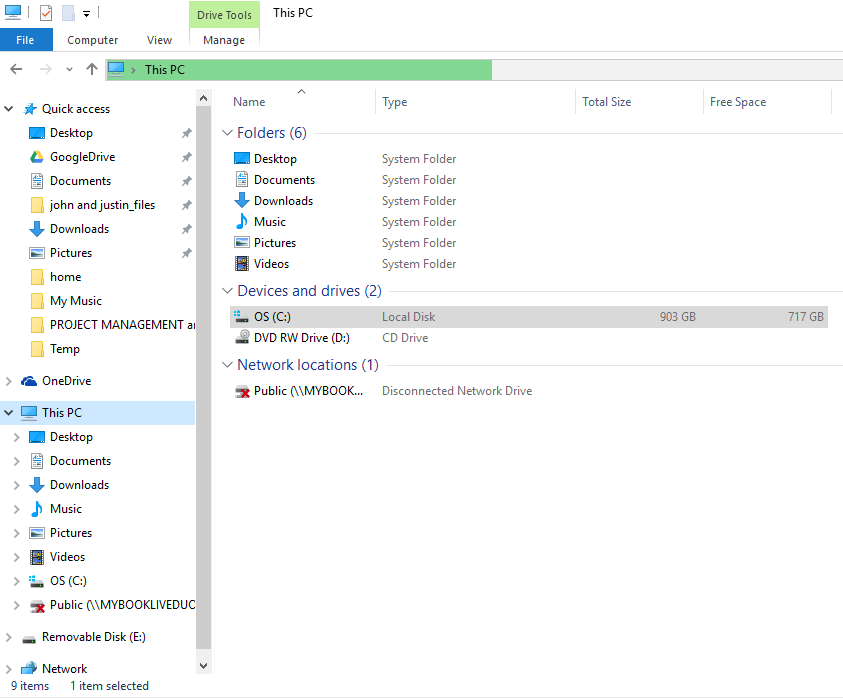
Oh, and the DVD drive? It was there all along. I see it when I highlight This PC:

Now with DVD drive
Now with DVD drive

Conclusion
If you don’t see your SD card when running Windows 10 don’t panic. It may be there alright. Type E: in the Quick Access field. Or maybe D: or F: – depends on your PC’s configuration, which I’ve shown how to list above. I believe a more permanent fix involves re-installing or repairing a driver, but I haven’t had time to look into it. My approach will get you working quickly in a pinch, like, say, when you have to get the photos off your camera’s SD card because you need them right now.

References and related articles
This Microsoft Technet discussion was helpful to me. It was slow to load however.

Categories
Admin Apache Hosting Service IT Operational Excellence Linux Web Site Technologies

Scaling your apache to handle more requests

Intro
I was running an apache instance very happily with mostly default options until the day came that I noticed it was taking seconds to serve a simple web page – one that it used to serve in 50 ms or so. I eventually rolled up my sleeves to see what could be done about it. It seems that what had changed is that it was being asked to handle more requests than ever before.

The details
But the load average on a 16-core server was only at 2! sar showed no particular problems with either cpu of I/O systems. Both showed plenty of spare capacity. A process count showed about 258 apache processes running.

An Internet search helped me pinpoint the problem. Now bear in mind I use a version of apache I myself compiled, so the file layout looks different from the system-supplied apache, but the ideas are the same. What you need is to increase the number of allowed processes. On my server with its great capacity I scaled up considerably. These settings are in /conf/extra/httpd-mpm.conf in the compiled version. In the system-supplied version on SLES I found the equivalent to be /etc/apache2/server-tuning.conf. To begin with the key section of that file had these values:

<IfModule mpm_prefork_module>
    StartServers             5
    MinSpareServers          5
    MaxSpareServers         10
    MaxRequestWorkers      250
    MaxConnectionsPerChild   0
</IfModule>

(The correct section is <IfModule prefork.c> in the system-supplied apache).

I replaced these as follows:

<IfModule mpm_prefork_module>
    StartServers          256
    MinSpareServers        16
    MaxSpareServers       128
    ServerLimit          2048
    MaxClients           2048
    MaxRequestsPerChild  20000
</IfModule>

Note that ServerLimit has to be greater than or equal to MaxClients (thank you Apache developers!) or you get an error like this when you start apache:

WARNING: MaxClients of 2048 exceeds ServerLimit value of 256 servers,
 lowering MaxClients to 256.  To increase, please see the ServerLimit
 directive.

So you make this change, right, stop/start apache and what difference do you see? Probably none whatsoever! Because you probably forgot to uncomment this line in httpd.conf:

#Include conf/extra/httpd-mpm.conf

So remove the # at the beginning of that line and stop/start. If like me you’ve changed the usual diretory where the PID file and lock file get written in your httpd.conf file you may need this additional measure which I had to do in the httpd-mpm.conf file:

<IfModule !mpm_netware_module>
    #PidFile "logs/httpd.pid"
</IfModule>
 
#
# The accept serialization lock file MUST BE STORED ON A LOCAL DISK.
#
<IfModule !mpm_winnt_module>
<IfModule !mpm_netware_module>
#LockFile "logs/accept.lock"
</IfModule>
</IfModule>

In other words I commented out this file’s attempt to place the PID and lock files in a certain place because I have my own way of storing those and it was overwriting my choices!

But with all those changes put together it works much, much better than before and can handle more requests than ever.

Analysis
In creating a simple benchmark we could easily scale to 400 requests / second, and we didn’t really even try to push it – and this was before we changed any parameters. So why couldn’t 250 or so simultaneous processes handle more real world requests? I believe that if all clients were as fast as our server it could have handled them all. But the clients themselves were sometimes distant (thousands of miles) with slow or lossy connections. Then they need to acknowledge every packet sent by the web server and the web server has to wait around for that, unable to go on to the next client request! Real life is not like laboratory testing. As the waiting around bit requires next-to-no cpu the load average didn’t rise even though we had run up against a limit, the limit was an artificial application-imposed one, not a system-imposed resource constraint.

More analysis, what about threads?

Is this the only or best way to scale up your web server? Probably not. It’s probably the most practical however because you probably didn’t compile it with support for threads. I know I didn’t. Or if you’re using the system-provided package it probably doesn’t support threads. Find your httpd binary. Run this command:

$ ./httpd -l|grep prefork

If it returns:

  prefork.c

you have the prefork module and not the worker module and the above approach is what you need to do. To me a more modern approach is to scale by using threads – modern cpus are designed to run threads, which are kind of like light-weight processes. But, oh well. The gatekeepers of apache packages seem stuck in this simple-minded one process per request mindset.

Conclusion
My scaled-up apache is handling more requests than ever. I’ve documented how I increased the total process count.

References and related articles
How I compiled apache 2.4 and ran into (and resolved) a zillion errors seems to be a popular post!
The mystery of why we receive hundreds or even thousands of PAC file requests from each client every day remains unsolved to this day. That’s why we needed to scale up this apache instance – it is serving the PAC file. I first wrote about it three and a half years ago!04

Categories
Admin Linux

Upgrading your JDBC driver for all you HP SiteScope fans

Intro
HP SiteScope is a pretty good and not overly pricey infrastructure monitoring solution. We’ve used it for years. An unexpected Oracle error sent us scrambling to remember how the heck we installed an Oracle JDBC driver on HP SiteScope the last time we did it, which was eons ago. As with many very specific yet important things on the Internet, the documentation available on the Internet was pretty spotty. Here is my attempt to remedy that. These instructions are for Redhat Linux, though I would think similar considerations would apply to the Windows version.

The details
Well all our Oracle database monitors were working just fine for years. So when asked to monitor a new database we simply copied one of the old ones and appropriately changed the connect string. But a strange thing happened. We got this error:

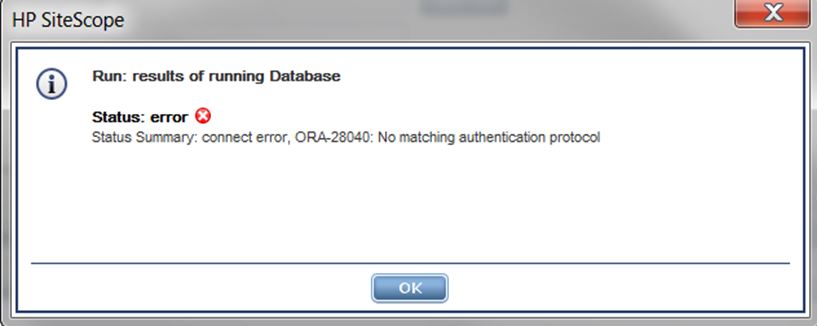
ORA-28040

ORA-28040: No matching authentication protocol

So we spoke with a DBA. This new database, being newer, was running a much more current version, Oracle 12C. I became convinced that our several-years-old JDBC driver for SiteScope simply wasn’t compatible. The DBA searched the oracle site and found supporting evidence for that hypothesis. So how to upgrade?

The latest JDBC Drivers can be found here on Oracle’s Website. We selected JDBC Driver 12c Release 1 (12.1.0.2) and downloaded the ojdbc7.jar file.

The thing is that to download it you need some kind of Oracle developer account. Fortunately I had one from years back and it still worked. So we were able to download it.

Where does it go?
The other breakthrough I had was simply to remember after thinking about it what the old jdbc driver was called. Its name wasn’t anything like ojdbc.jar. No, it was classes12.jar!

Of course memories can be tricked. To confirm that that jar file looked basically right we did a

$ jar tvf classes12.jar

Sure enough, there were a bunch of lines for oracle/jdbc/blah, blah. Then out of curiosity I tried to check the actual classpath of the SiteScope process with something like this:

$ ps -ef|grep java|grep classes12

and sure enough, it highlighted a java process – clearly belonging to HP SiteScope – and the classes12.jar therein.

So memory confirmed.

Speculative next steps
This part is speculative and may not be necessary though it doesn’t seem to hurt anything. I wanted to maximize my chance of success the first time, rather than stopping/starting HP SiteScope multiple times, right? So I didn’t see a quick way to tell HP SiteScope that, hey, the new driver to use is ojdbc7.jar, not classes12.jar so I tried to force its hand. We moved the classes12.jar file out of its directory:

$ cd /opt/SiteScope/WEB-INF/lib; mv classes12.jar /tmp

and put the new jdbc file in that directory, and made a sym link from the old driver to the new one for good measure!

$ ln -s ojdbc7.jar classes12.jar

We tested if we could get away without stopping/restarting HP SiteScope. Nope. It didn’t pick up the new driver. So we were a little nervous. So we did the stop/start thing:

$ service hpss stop; service hpss start

It takes awhile, but…

Yes, the new monitor began working! Of course we were worried a bit about backwards compatibility between the 12C driver and the older version 11 databases, but those continued to work as well.

Conclusion
Installing a recent JDBC driver fixes the ORA-28040 error for our HP SiteScope installation. Was that sym link really necessary? I don’t know for sure, but I see that the java process still has classes12.jar in its path. It does not have ojdbc7.jar! There’s probably a way to modify the classpath, but I don’t know it. So in my case I’d be inclined to say Yes it was.

References and related articles
Oracle’s version 12C JDBC driver.
I rail against HP’s bureaucratic ways in this older posting.
My last HP SiteScope upgrade is documented here.

Categories
Admin Network Technologies

The IT Detective agency: bad PING times explained

Intro
In a complicated corporate environment somewhat unusual problems can be made extremely difficult to debug as there may be many technicians involved, each one knowing just their piece of the infrastructure. Such was the case when i consulted for a problem in which a company reported slow Internet response for users in Asia.

The details
In preparation for an evening call I managed to get enough access to be able to log into the proxy server their Asian users use. Just issuing regular commands was slow, often hanging for many seconds.

The call
So we had the call at 9 PM. These things are always pretty amazing in the sense of How do corporations ever get anything done when they’ve outsourced so much? So there was a representative from the firewall team from Germany, representative from the telecom in the US, a couple representatives from the same telecom but stationed in Asia, an employee who oversees the telecom vendor in the US and me, representing the proxy service normally handled by a group in Europe. The common language was English, of course, though that doesn’t mean that everyone was easy to understand for us native speakers. No one on the call had any real familiarity with the infrastructure. We were all essentially reverse engineering it from a diagram the telecom produced.

The firewall guy and I both noticed that PINGs from the proxy to its gateway (which was a firewall) took 50 msec. I’ve never seen that. Same for another piece of equipment using that same firewall interface. The telecom, which was responsible for the switches, could not actually log in to all of them. Only the firewall guy could reach a few of them. And he eventually figured out the diagram we were all using was somewhat wrong and different switches were in use for some of the equipment than indicated. Which was important because we wanted to check the interface status on the switch.

So imagine this. The guy with no access to anything, the vendor overseer in the US, patiently asks for the results of a few commands to be shared (by email) with the group. He gets the results of show interface status and identifies one port as looking off. It’s listed as 100 mbit instead of 1 gig. In addition to the strange PNIG times, when we PINGed from equipment in the US, packet loss rate varied frmo between 4 – 15%. Pretty high in other words. They try to reset the port, hard-code both sides, but nothing works. And this is the port that the firewall is connected to.

We finally switch to the backup firewall. This destroys the routing and so that has to be fixed. But finally it is and suddenly response is much better and PINGing the gateway from the proxy is at the expected < 1 msec. Not content to leave it at that, they persist to fix the broken port. Thy reason that the most likely problem after the test results are in is a bad cable. He explains that in 1 gig communication all 8 wires have to be good. If just one breaks you can't run 1 gig. Now they have to figure out who has access to this 3rd-party data center where the equipment is hosted! They finally identify an employee with access and get him to come with different cable lengths (of course no one knows the layout to actually know how long the cable is or how close the equipment is). The cable is replaced and both sides come up 1 gig auto-negotiated! They reverted back to the primary firewall. So in the end the employee without access to anything figured this out. Amazing. The intense activity on this problem lasted from 9 PM to about 4 AM the following morning. The history
Actually it would be a pretty decent turn-around by this company’s standards if the problem had been resolved in seven hours. But actually it had been ongoing for a couple weeks beforehand. It seemed that the total data usage was capped at 100 mbits by that bad cable and so it wasn’t a total outage or totally obvious where to look.

Case closed!

Conclusion
I think a lot of people on the call had the expertise to solve the problem, and much more quickly than it was solved. But no one had sufficient access to do debugging his own way and needed cooperation of others. The telecom who owns and manages the switches particularly disappointed in their performance. Not in the individuals, who seemed to be competent, but in their processes which permitted faulty and incomplete documentation, as well as lack of familiarity with the particular infrastructure – like you’ve just hired a smart network technician and communicated nothing about what he is supporting.
Keep good people on staff! Give them as much access as possible.

Categories
Admin Network Technologies

General failure PING error partially explained

Intro
My Dell PC running Windows 7 was going along fine until one day I noticed I couldn’t get out to the Internet from any browser. As a network specialist I reacted in my standard knee-jerk fashion and tried a few simple network commands from the command prompt to get a better idea of what’s going on.

The details

Here is the first thing I tried – to ping one of Google’s DNS servers which always respond so if you don’t get a response there’s something wrong on your side.

C:\Users\DrJ>ping 8.8.8.8

Pinging 8.8.8.8 with 32 bytes of data:
Request timed out.
General failure.
General failure.
General failure.
 
Ping statistics for 8.8.8.8:
    Packets: Sent = 4, Received = 0, Lost = 4 (100% loss),

Weird. Never seen that before.

Then it gets stranger
Then I tried to ping my local router. But first I had to find its IP address:

C:\Users\DrJ>netstat -rn

blah, blah
IPv4 Route Table
===========================================================================
Active Routes:
Network Destination        Netmask          Gateway       Interface  Metric
          0.0.0.0          0.0.0.0    192.168.0.254    192.168.0.102     25
blah, blah

Then ping it:

C:\Users\Dad>ping 192.168.0.254

Pinging 192.168.0.254 with 32 bytes of data:
Reply from 192.168.0.254: bytes=32 time=2ms TTL=64
Reply from 192.168.0.254: bytes=32 time=1ms TTL=64
 
Ping statistics for 192.168.0.254:
    Packets: Sent = 4, Received = 4, Lost = 0 (0% loss),
Approximate round trip times in milli-seconds:
    Minimum = 1ms, Maximum = 2ms, Average = 1ms

That’s a normal response, which under the circumstances is also weird. So we can’t ping the Internet but we can ping our local router. Sounds like a problem with either my Internet connection or my home router, right? Yeah, maybe, except for these two important facts. Routers have built-in simple diagnostic tools like PING. So I logged into the local router and ran a ping to 8.8.8.8 and it worked just fine. OK that’s one. Two is that you get a different failure message when your Internet connection is down. I unplugged my DSL router and got this more familiar error:

C:\Users\DrJ>ping 8.8.8.8

Pinging 8.8.8.8 with 32 bytes of data:
Request timed out.
Request timed out.
Request timed out.
Request timed out.
 
Ping statistics for 8.8.8.8:
    Packets: Sent = 4, Received = 0, Lost = 4 (100% loss),

I also observed that if I just waited it out (doing all these tests kills a few minutes) the connection would come back by itself after about 9 or 10 minutes. I timed rebooting. On my PC it’s about six minutes before I have a working Internet connection again. Not very impressive, but that’s how it is.

A Google search showed a bunch of sites with junk answers apparently trying to push adware on your PC. You know those sites that have somehow documented every single PC problem, supposedly, and have a boilerplate bogus generic description of likely causes and the generic fixes which are all the same but actually have nothing whatsoever to do with the specific problem? I’m getting really annoyed with those sites. But one guy mentioned a firewall. I am running McAfee Livesafe. Hmmm.

Self-inflicted denial of service attack
Yup. From the Windows start menu I typed in McAfee to launch it. I navigated to the part for Web and Email protection. Turned off firewall protection.
McAfeeFirewall
The instant I did that my browsers sprung to life! Gmail started working. All was good.

So in the business this is what we call a self-inflicted denial of service, which is somewhat of a tongue-in-cheek name, but apt. A security service that shuts everything down is just as bad as no security whatsoever. I tried to check the McAfee logs to look for a bright red warning that says we’re shutting you down for now but haven’t found anything like that.

And those pings to Google? They now look like this:

C:\Users\DrJ>ping 8.8.8.8

Pinging 8.8.8.8 with 32 bytes of data:
Reply from 8.8.8.8: bytes=32 time=88ms TTL=40
Reply from 8.8.8.8: bytes=32 time=64ms TTL=40
Reply from 8.8.8.8: bytes=32 time=63ms TTL=40
 
Ping statistics for 8.8.8.8:
    Packets: Sent = 4, Received = 4, Lost = 0 (0% loss),
Approximate round trip times in milli-seconds:
    Minimum = 63ms, Maximum = 88ms, Average = 69ms

2nd possible cause
Today I also witnessed General failure in testing ping to a single particular destination on a Windows server. So first thing we checked is the Windows firewall. It was disabled. So what else could it be? Since it was a server in a complex environment the application owner had added routes. But he wasn’t very familiar with the route command so he just literally added routes with all the options present like in their example under route /help:

$ route ADD 157.0.0.0 MASK 255.0.0.0 157.55.80.1 METRIC 3 IF 2

Only he chose IF 1. This created the bizarre situation where the route was added with the correct gateway, but the wrong interface! The system assigned IF 1 to 127.0.0.1. So those packets weren’t going anywhere because that’s the loopback interface! I suggested to delete that route, then add it without the METRIC and IF options – that’s how I’ve always done it.

Result: General failure disappeared.

Conclusion
A Windows system reports General failure during a PING test when the ICMP packets cannot leave the system. This can be due to running a local firewall or having bad routes present.