Intro
It’s been awhile since I have added a case to the canon of It detective stories which I have personally solved. It’s not that things don’t need resolving. They do! But either they look like what has come before, so there’s nothing new, or they are so new I’m still in the middle of them and you never know if they will ever be solved… Such was the situation with today’s subject: WiFi calling.
WiFi calling, which most people are blissfully ignorant of, can be very necessary if you are in a large building which shields you from cell phone tower signals and does not have any in-building signal boosters. In this situation, as long as you’ve enabled WiFi calling on your phone, it will be smart enough upon seeing no cell signal, to switch to using WiFi, assuming an access point and WiFi is reachable.
Well, such is the case at some office building my company has. And wiFi calling was found to be OK for phones using T-Mobile. But not for Verizon. With Verizon (VZ) phones WiFi calling was at best unpredicatble: sometimes the call would go through and sometimes not.
Unfortunately there were a lot of parties involved in the communication path. WLCs (wireless LAN controllers) have access points (APs) connect to them. they in turn tunnel the communication to another site where the anchor controller resides. Then it gets handed off to a perimiter firewall for NATing and egress via Internet routers. The Internet routers have some sort of load-balancing in place. We don’t run them any more the way we used to. A vendor does that now. And firewalls are handled by a different group. And a different group is in charge of mobile devices. The phone also has a Global protect client and hence an always-on VPN connection. That part is run by yet another group! So you see how this gets impossibly messy. I realized I was in a pretty good place – probably th best place compared to anyone else – to do this troubleshooting however because I touched many of the groups or had “good friends” there.
What does failure look like?
On my phone, a failed attempt looks like this. I place a call, and it doesn’t go through. It also doesn’t not go through. I just never hear anything. I wait for up to a minute, because, who is going to wait more than a minute to hear something after they’ve dialed the number?
More details
At the site they convinced themselves that whereas one SSID works, a second SSID which actually uses the same path, does not. For my part I wasn’t so sure. Eventually under my fairly extensive testing I could produce the problem every time by rebooting my phone and then placing a WiFi call very quickly afterwards.
Fun aside: how to force
WiFi calling even when you have signal
On an Android device go to airplace mode. Your WiFi is then disabled. But you can re-enable your WiFi and airplace mode will stay on! Now when you bring up the built-in voice calling app, you will see the green phone icon with a WiFi icon superimposed over it. That’s how you know you are placing a WiFi call.
But then if I did nothing for about 30 minutes, often my next attempted WiFi call would go through! Go figure. And the call after that would work as well, etc. But maybe a couple hours later the whole thing would break again. I don’t think they were that systematic in their testing.
Verizon to the rescue
After spinning our wheels helplessly we finally got a call with a tech engineer from Verizon who was helpful. Because at some point you think to yourself, the app developer of the phone should be able to instrument the voice app with verbose logging to say what it thinks the problem is. Let’s switch to the firewall where I have good access to the logs as well as a good colleague willing to grind it out with me. Well this is a Checkpoint firewall and the logs are filled with drops. Checkpoint logging says First packet isn’t SYN. So what the VZ guy said which helped us focus is that you want to look for the tunnels to 14.20.0.0/16 or something like that. maybe it’s more like 14.20.128.0/17, or something that rhymes with that! In any case, we didn’t believe the First packet isn’t SYN drops were hurting us too much as we get those a lot, yet things just work.
Then there were dns requests to 8.8.8.8. Why/ That’s not the dns server we configured in dhcp (another one of my sub-specialties). And even if the right dns server was being used, it was always possible it was hitting a dns firewall rule. So that had to be ruled out. And it did seem dns did not play into this. Then there was the worrisome matter of the vpn tunnel created by GPC. What if, somehow, these packets were going over that tunnel? They shouldn’t, but what if they do? Well, then we should see that traffic in the GPC logs (another of my sub-specialties). We didn’t. So I became somewhat comfortable ruling out GPC.
So back to VZ. The guy said on our test call that he saw the tunnel initially established, then there was no more communication over it. And so the tester did not receive the test call for him. So when we looked for destination 141.207…, yeah we could see IKE and IPSEC communication. We could see a tunnel being estabvlished over udp port 500, thn further communication to that same destination over udp port 4500. These are pretty much the standard ports for IKE. the VZ guy said he did not have access to be able to do a trace on the IKE peer. We could do a packet trace on our firewall however.
More testing
So we never did see an official drop in the checkpoint logs. Still, I began to suspect that firewall and my colleague agreed with me, or at least agreed to try some things. But first, another red herring. the VZ guy suggested we could trace the packets on the phone with pcapdroid or something like that. So I got that running on my phone. But to work it creates its own IKE tunnel, uses completely different IP addressing, and just generally makes it impossible to account for these IKE packets going to VZ.
On Checkpoint you have a general setting for how it will handle “NAT traversal’ for IKE connections. It looks like this:
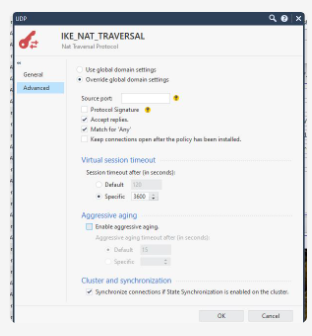
By the way, tracing on the firewall isn’t all that easy since there are two interfaces. We actually were running tcpdump on the inward-facing interface while running fw monitor on the outbound interface! That’s not so easy to coordinate. Neither D nor I had ever done it before. We never did reach that Aha moment where you say, look, the packet destined for the tunnel enters here, and doesn’t go out here. There was just too much competing traffic. But anyway, D wanted to play with the NAT traversal settings, which seemed easier.
First adjustment: aggressive aging
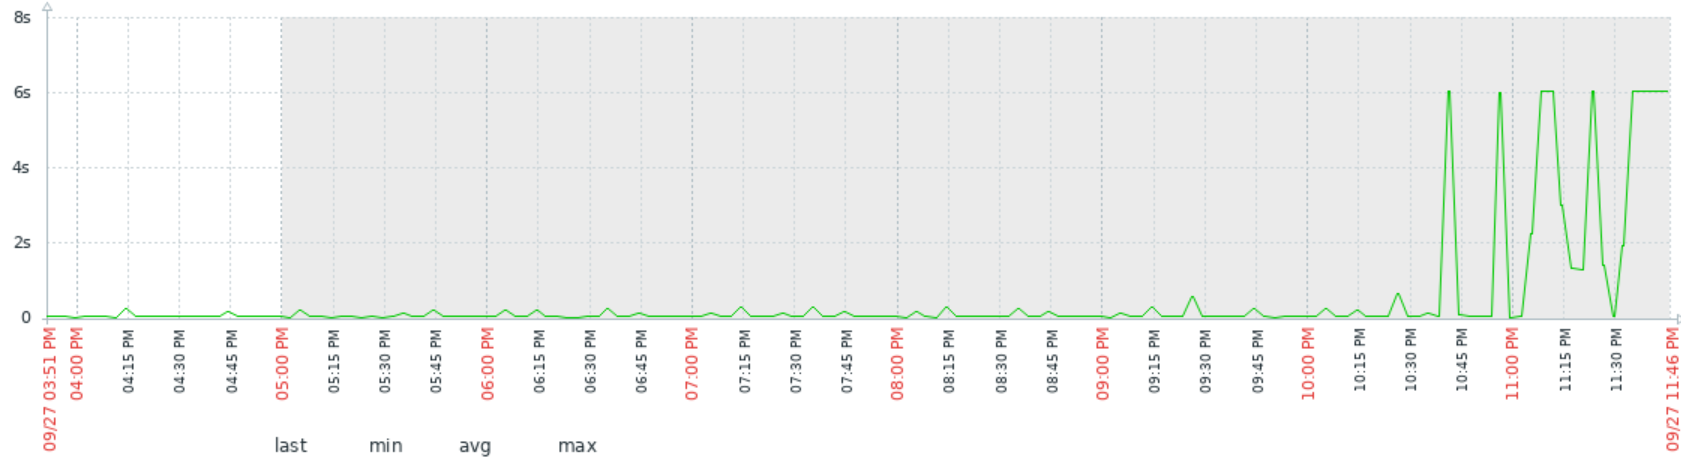
The first thing D did was to turn off aggressive aging. Well, that helped a lot. With that, I was able to place my WiFi calls successfully every time after a reboot!
But this thing is tricky. We were chatting. Some time had passed. I placed another test call. Nope. that one didn’t go through! Drat. We had more homework to do. i had been recording the exact times of the calls pretty carefully. About 16 minutes had elapsed between the two calls.
To be continued…
Conclusion
In one of our most difficult cases, we got WiFi calling working reliably on Verizon phones. There were a lot of parties involved and a lot of false leads: look for asymmetric routing, etc.. The real problem was the IKE NAT traversal settings on a Checkpoint firewall. everyone involved is much happier now.
Case: closed!
References and related
I need to find the link to the VZ network requirements doc.